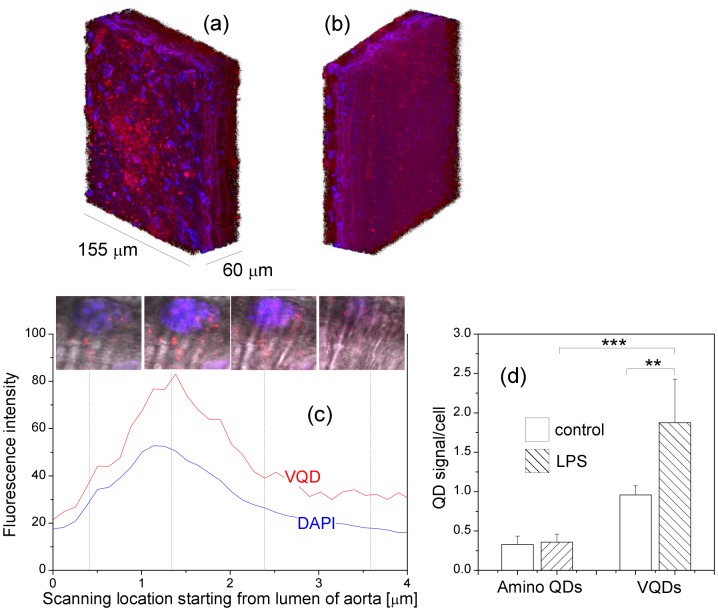
Figure 5. (a–b) Three-dimensional projection image of the aorta from one LPS-treated mouse.
The aorta was labeled ex vivo with VQDs for 5 hours. The image was rotated so that the endothelial layer is shown in (a) and the adventitia is shown in (b). Blue signals come from DAPI nuclei staining and red from QDs. (c) Transversal distribution of fluorescence signals in mouse aorta. The scanning started from aortic lumen. The insets show confocal images in four different locations across the aorta. (d) Quantification of the QD signals in the endothelium of aorta from control and LPS-treated mice. Aortas were labeled ex vivo with amino QDs or VQDs for 5 hours, respectively. Values are means SD.
SD.  ,
,  .
.

