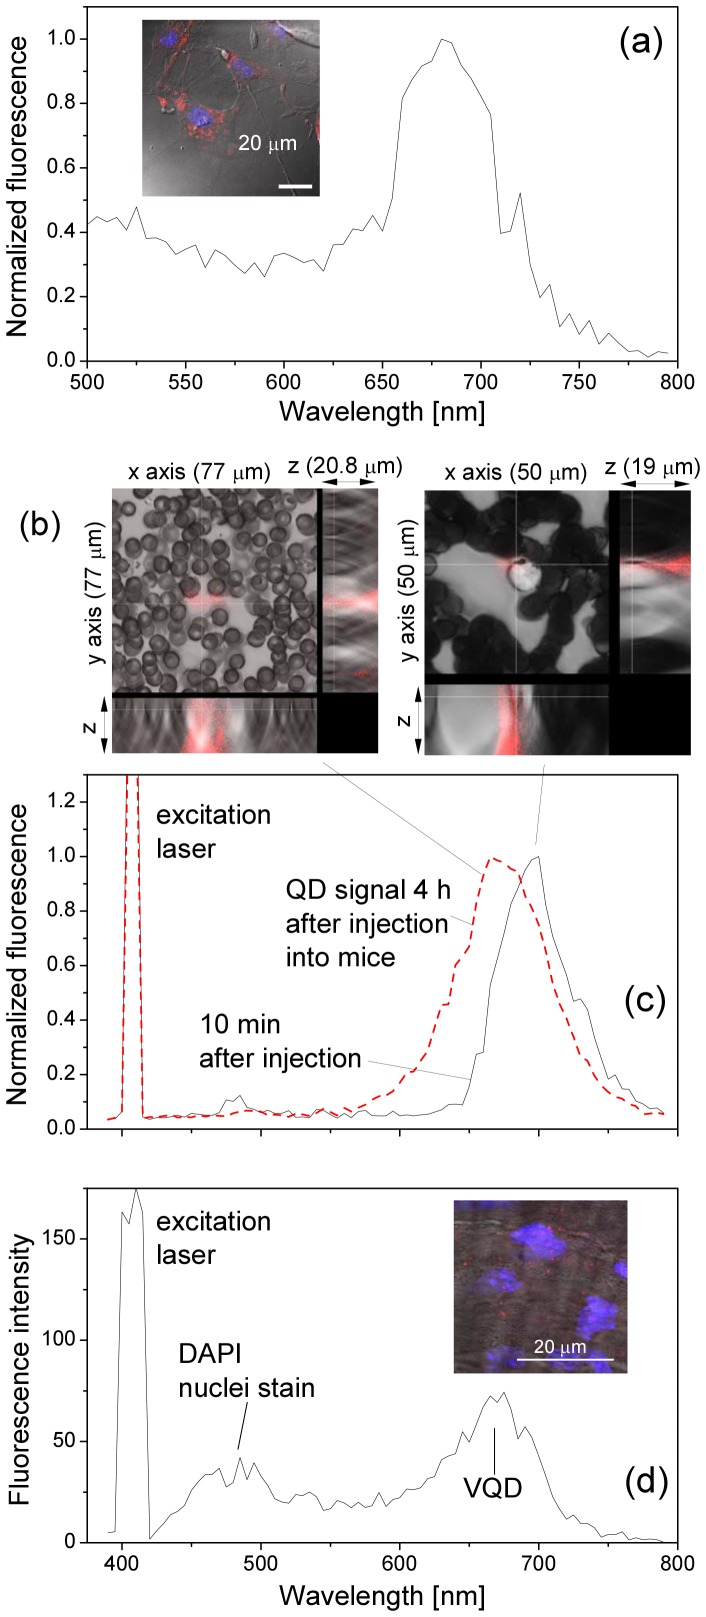
Figure 7. Blue-shift of the QD fluorescence peak from (a) cultured endothelial cells, (c) blood smear and (d) endothelial layer of mouse aorta.
Inset in (a): Confocal image of TNF- treated-endothelial cells incubated with VQDs for 24 h. (b): Three-dimensional confocal images of blood smears took at 10 minutes (left) and 4 hours (right) after VQD injection. The cross of two axes is the point where QD spectra in (c) were measured. Inset in (d): Confocal image of the aortic endothelial layer of LPS-treated mouse 4 hours after VQD injection. Blue signal is DAPI nuclei staining and red signal from QDs.

