Fig. 2.
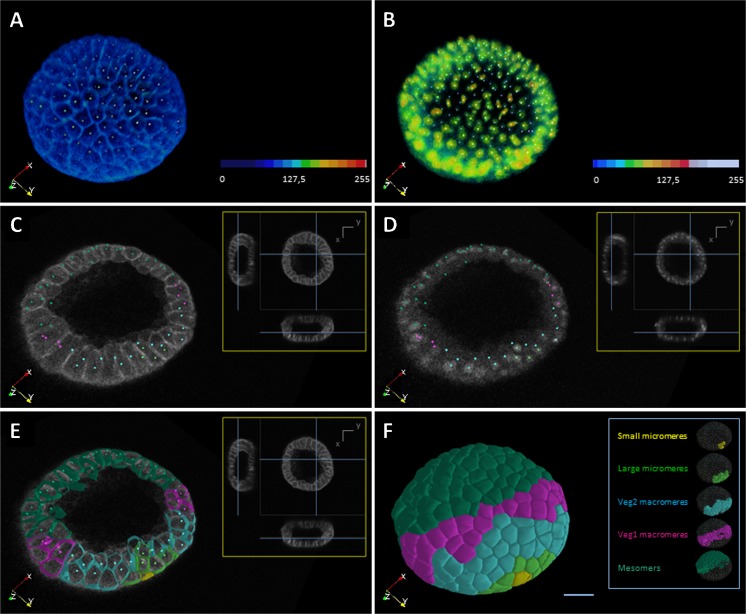
Paracentrotus lividus embryo reconstruction at the 370-cell stage. Raw and reconstructed data displayed with the Mov-It interactive visualization software. Raw data with cell membranes (a) and nuclei (b) staining represented in volume rendering according to the color map displayed bottom right. Colored dots indicate the approximate nucleus center for each cell. Orthoslice in the x y plane for raw membranes (c) and nuclei (d), colored dots as in a,b; in the inset, orthoslices of raw data and their position in the volume indicated by blue lines. e Same as in c, with a cut of the segmented surfaces in addition. f Isosurfaces of segmented membranes. The different cell populations (i.e., small and large micromeres, Veg2 and Veg1 macromeres, and mesomeres) are displayed in different colors, color map described on the right. a–f Referential displayed bottom left. Scale bar 20 μm (Images from Duloquin, L., and Rizzi B., unpublished)

