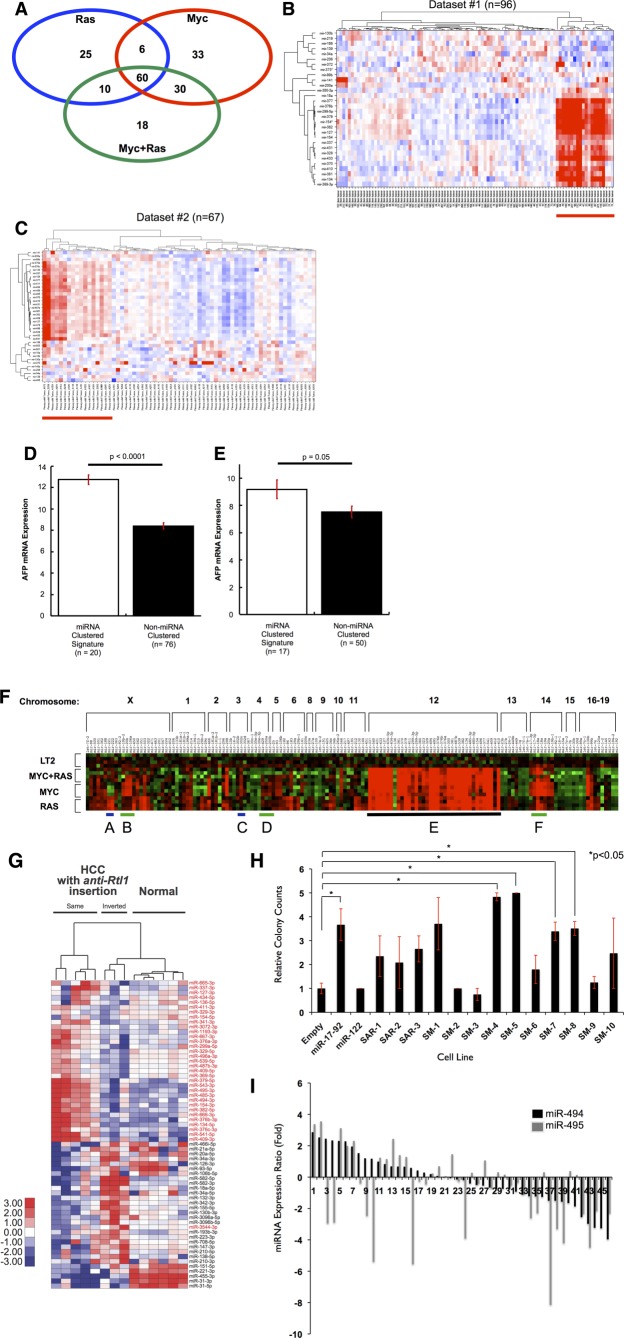
Figure 2.
An miRNA megacluster containing multiple transforming miRNAs is up-regulated in mouse tumor models (A) Venn analysis of differentially expressed miRNAs in MYC, RAS, and MYC+RAS Tg mice indicate substantial overlap. MicroRNA signatures from each mouse line were analyzed using one-way ANOVA comparisons with a minimum fold change log2 >1 or <−1 at a P value <0.05. The intersection of the three signatures indicated that 60 miRNAs were commonly shared among these mice. Orthologs of these miRNAs were used for subsequent analysis in human HCC cohorts. (B and C) Distinct subsets of human HCC tumors with up-regulated miRNA orthologs of the 60-miRNA murine signature. Two-dimensional unsupervised hierarchical clustering of orthologous miRNAs was performed based on miRNAs from the murine signature. (B) Thirty for Dataset#1.20 (C) Thirty-eight for Dataset#2, TCGA LIHC. Red indicates miRNA up-regulation, blue indicates down-regulation on the heat maps. (D and E) AFP expression is elevated in human HCC tumors that exhibit high miRNA signature. Mean AFP mRNA expression is depicted, and error bars represent standard error of the mean. (D) Dataset#1; (E) Dataset#2. (F) Hierarchical clustering of all miRNAs located within 1 kilobase of each other in the mouse genome reveals an up-regulated megacluster on Chr12qF1 in mouse tumors (heat-map region E, underlined in black). miR-17-92 oncomiR cluster and its homologs are indicated with green lines (heat-map regions B, D, and F). RAS-regulated miR-221-222 cluster shows RAS specific expression (heat-map region A), whereas MYC regulated miR-302b-d cluster shows MYC specific expression (heat-map region C). (G) SB transposon integration in the same transcriptional orientation as the anti-Rtl1 cluster causes HCCs in mice, accompanied by an up-regulation of Dlk1-Dio3 miRNAs (indicated in red). This is compared to HCCs with inverted SB insertions in the anti-Rtl1 cluster and normal livers that have no Dlk1-Dio3 miRNA up-regulation. (H) Quantification of soft agar colonies formed by each LT2MR stable cell line. miR-17-92 and miR-122 were used as positive and negative controls, respectively. Values are average of three independent experiments. SM-4, -5, -7, and -8 subclusters significantly increased transformation, when compared to LT2MR cells stably expressing a control pMSCV vector (*P < 0.05). (I) Relative expression of miR-494 and miR-495 from 47 human HCC tumor and matched normal samples were analyzed by qRT-PCR. miRNA abundance was normalized to RNU48. Differences in expression are shown as fold change over matched normal tissue.

