
Figure 3.
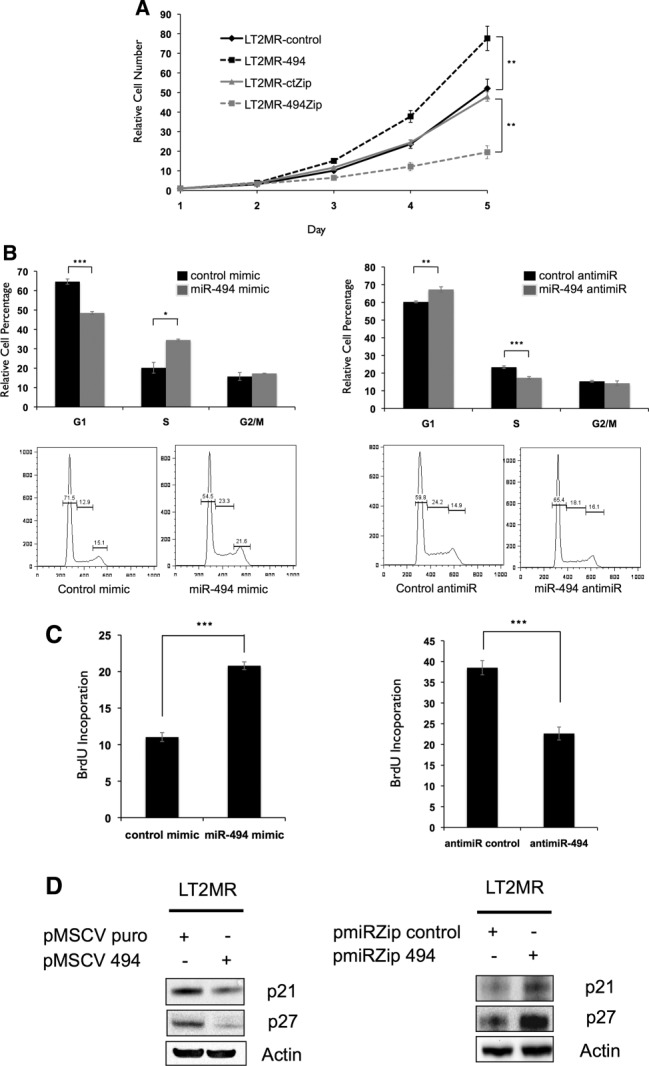
miR-494 increases proliferation through accelerated G1/S transition. (A) LT2MR cells undergo increased proliferation with enforced miR-494 expression and decreased proliferation with miR-494 inhibition. Fifty thousand cells were plated in triplicate and counted at days 1, 2, 3, 4, and 5 after transfection of pMSCV puro, pMSCV 494, pmiR-ZIP-control, or pmiR-ZIP-494. Cell numbers were normalized to day 1. Experiment was repeated three times, and values are from one representative experiment. **P = 0.01. (B) LT2MR cells exhibit accelerated G1/S transition with enforced miR-494 expression and G1/S delay with miR-494 inhibition. LT2MR cells transfected with miR-494 or control mimic and miR-494 or control inhibitor for 48 hours were stained with propidium iodide for fluorescence-activated cell sorting analysis. Cell-cycle profiles were analyzed using FlowJo analysis software (Tree Star, Inc., Ashland, OR). Experiment was done with three replicates per sample, and values were averaged to generate graphs (top panels). *P = 0.01; **P = 0.003; ***P = 0.001. Figure is representative of three experiments. (C) BrdU incorporation in miR-494 overexpressing cells. LT2MR cells were transfected with either miRNA mimics (left panel) or miRNA inhibitors (right panel) for 48 hours and exposed to BrdU for 40 minutes. Flow cytometry was used to measure BrdU incorporation. Experiment was repeated three times with three replicates per sample, and values are from one representative experiment. ***P = 0.008. (D) Expression of cell-cycle inhibitors corresponds to proliferation. Stable cell lines with either increased (left panel) or decreased miR-494 (right panel) expression were generated and tested for expression of p27 and p21 by western blotting.