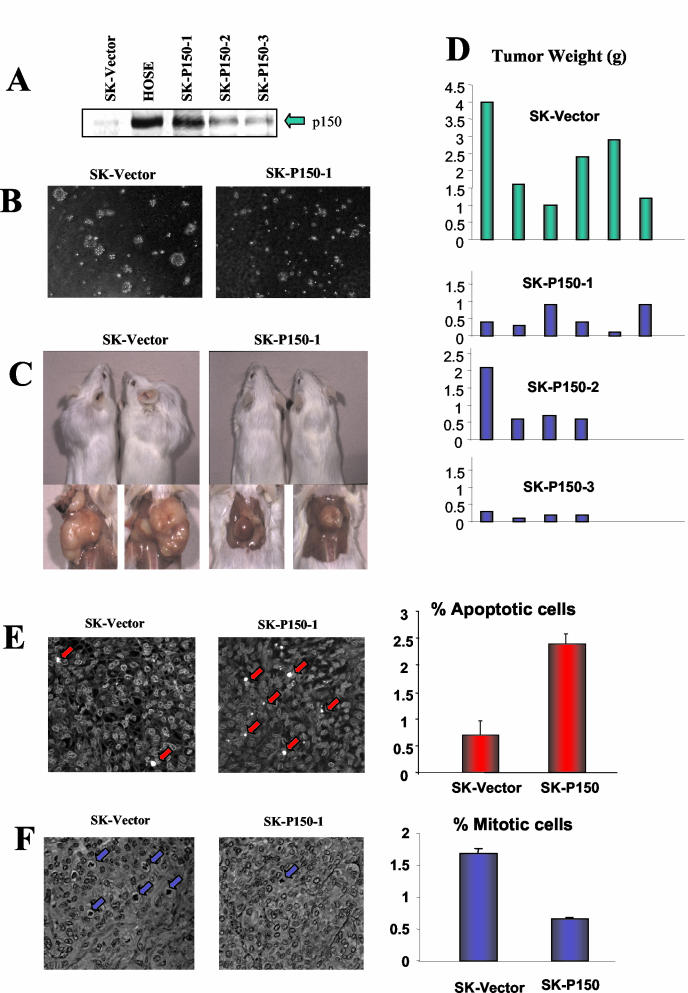
FIG. 2.
Effect of p150 expression on tumorigenicity. (A) Western blot comparison of p150Sal2 expression in normal HOSE cells, pooled neomycin-resistant SKOV-3 cells transfected with empty vector (SK-vector), and three independently derived SKOV-3 clones with various p150Sal2 expression levels (SK-P150-1, -2, and -3). (B) Representative figure showing the reduction of anchorage-independent growth in SK-P150 cells with restored p150Sal2 expression compared to SK-vector cells. (C) SCID mice inoculated by SKOV-3 cells with stably integrated empty vector (SK-vector) and SKOV-3 cells with stably integrated p150 expression construct (SK-P150-1). (D) Weights of tumors from SK-vector cells and from three independent SKOV-3 clones with human p150 (SK-P150-1, SK-P150-2, and SK-P150-3). (E) Apoptosis in SK-vector- and SK-P150-induced tumors. TUNEL staining of sections of SK-vector and SK-P150-1 tumors is shown at left (arrows indicate TUNEL-positive cells). Quantification of apoptotic cells in SK-vector and SK-P150-1 tumors is shown at right. Results are the averages for two independent tumors of each type, two sections of different areas, and three random fields of each section. (F) Mitosis in SK-vector and SK-P150 tumors. Hematoxylin and eosin staining of sections of SK-vector and SK-P150 tumors is shown at left (arrows indicate mitotic cells). Quantification of mitotic cells in SK-vector and SK-P150 tumors is shown at right. The sampling was the same as described for panel E.

