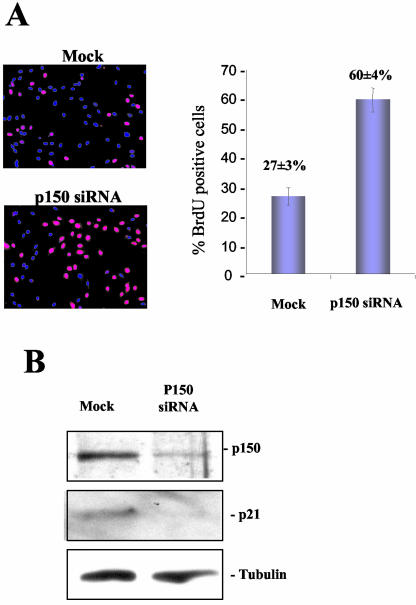
FIG. 4.
RNA interference analysis with HOSE cells. (A) Mock-transfected or p150 siRNA-transfected HOSE cells were cultured in BrdU-containing medium for 20 h (left panels). Nuclei with BrdU incorporation were stained with anti-BrdU antibody (red). Nuclei were also stained with DAPI (blue). The results were quantified by counting BrdU-positive cells in four random fields as the percentage of total cells (right). (B) Western blot analysis showing reduced p150Sal2 levels after addition of siRNA (P150 siRNA) and reduced p21 levels in HOSE cells compared to what was seen with mock-transfected cells. The same blot was stripped and reprobed for α-tubulin as the loading control.

