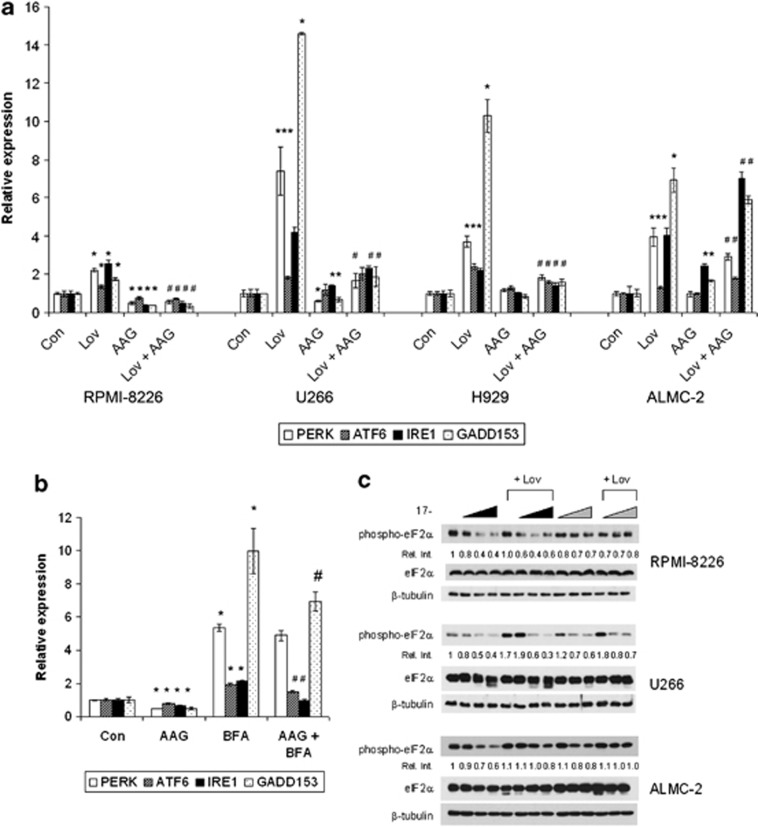
Figure 4.
Effects of HSP90 and IBP inhibition on components of the UPR. (a) RPMI-8226, U266, H929 and ALMC-2 cells were incubated for 48 h in the presence or absence of lovastatin (Lov) and/or 17-AAG (AAG). For the RPMI-8226, U266 and ALMC-2 cells, 10 μM lovastatin and 0.5 μM 17-AAG were used, whereas for the H929 cells, 2.5 μM lovastatin and 0.25 μM 17-AAG were used. Real-time PCR was performed using primers for PERK, ATF6, IRE1 and GADD153. Data were normalized to β-actin levels and are expressed as relative to control untreated cells (mean±s.d., n=3). Data are representative of two independent experiments. The * denotes P <0.05 per unpaired two-tailed t-test and compares treated cells with control cells. The # denotes P <0.05 for the combination of lovastatin+17-AAG compared with lovastatin alone. (b) Real-time PCR was performed using primers for PERK, ATF6, IRE1 and GADD153 following incubation of RPMI-8226 cells with 0.5 μM 17-AAG (AAG) and/or 0.5 μM brefeldin A (BFA) for 24 h. Data were normalized to β-actin levels and are expressed as relative to control untreated cells (mean±s.d., n=3). Data are representative of two independent experiments. The * denotes P <0.05 per unpaired two-tailed t-test and compares treated cells to control cells. The # denotes P <0.05 for the combination of 17-AAG and BFA compared with BFA alone. (c) Immunoblots depicting phosphorylated eIF2α (phospho-eIF2α), eIF2α and β-tubulin (loading control) from RPMI-8226, U266 or ALMC-2 cells treated with 10 μM lovastatin (Lov) and/or 17-AAG (AAG). The wedges indicate increasing concentrations of 17-AAG (0.1, 0.5, 1 μM). The black wedges indicate that 17-AAG was added at the start of the 48 h incubation, whereas the gray wedges indicate that 17-AAG was added after 24 h. The relative intensity (Rel. Int.) was determined using densitometry and compares the treated cells with the control cells. Gels are representative of at least two independent experiments.

