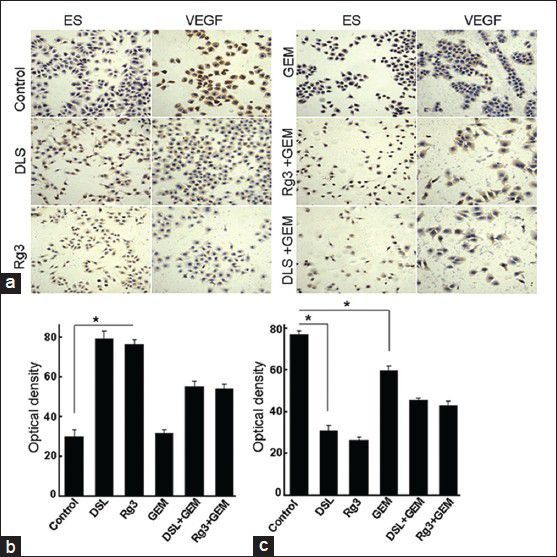
Fig. 3.

The expression of ES and VEGFR-2 in HepG2 examined by immunohistochemistry.
(a) HepG2 cells treated with different drugs were stained for ES and VEGFR-2. Cells were counter-stained with hematoxylin, and were photographed under a microscope. The brown point in the picture is positive signal and the control is HepG2 cells without drug treatment. (b) (ES) and (c) (VEGFR-2) are the analysis of the data in A. Positive signals were quantified using Image-Pro Puls 5.1, and were compared for statistical significance. Data represent the average of three experiments. Bars, means ± SD (*P<0.05;n>3).
