
Fig. 1.
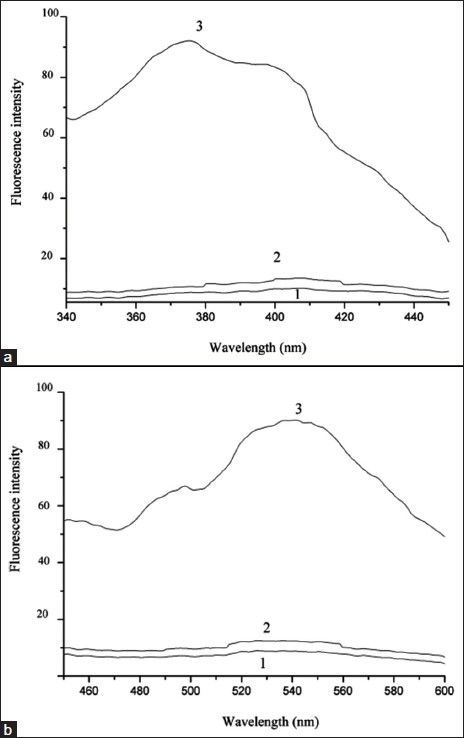
The excitation and emission spectra.
The excitation (a) and emission (b) spectra of Rutin (1), Rutin-Y3+ (2) and Rutin-Y3+-SDBS (3). Concentrations: Y3+: 1.5×10⁻⁴ mol/l, Rutin: 1.0×10⁻⁶ mol/l, SDBS: 5.0×10⁻³ mol/l, pH=9.5.
Official websites use .gov
A
.gov website belongs to an official
government organization in the United States.
Secure .gov websites use HTTPS
A lock (
) or https:// means you've safely
connected to the .gov website. Share sensitive
information only on official, secure websites.
The excitation and emission spectra.
The excitation (a) and emission (b) spectra of Rutin (1), Rutin-Y3+ (2) and Rutin-Y3+-SDBS (3). Concentrations: Y3+: 1.5×10⁻⁴ mol/l, Rutin: 1.0×10⁻⁶ mol/l, SDBS: 5.0×10⁻³ mol/l, pH=9.5.