Figure 5.
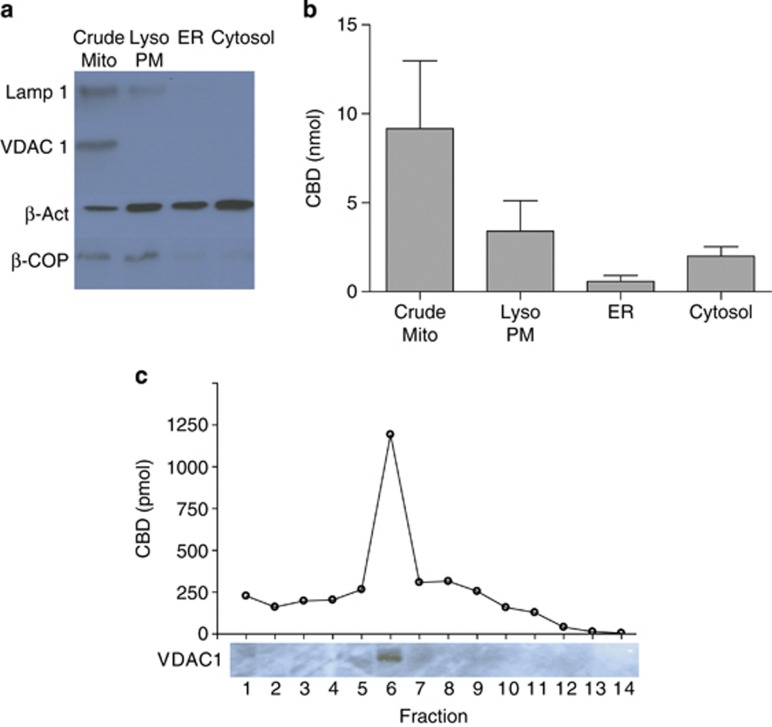
CBD colocalizes with VDAC1-rich mitochondrial membranes (a) Cell organelles were separated into four fractions. An equal amount of protein was loaded per lane. The results are representative of two independent experiments. Protein marker distribution among the following fractions: crude mitochondria (Crude Mito), lysosomes and plasma membrane (Lyso/PM), endoplasmic reticulum (ER) and cytosol using western blot analysis. (b) CBD concentration in these fractions was quantified using LC/MS/MS. (c) CBD concentration as detected in the various fractions of a continuous OptiPrep/sucrose membrane density gradient. CBD was mostly concentrated in fraction 6 and colocalized with the mitochondrial protein VDAC1. Data are representative of three independent experiments

