Figure 6.
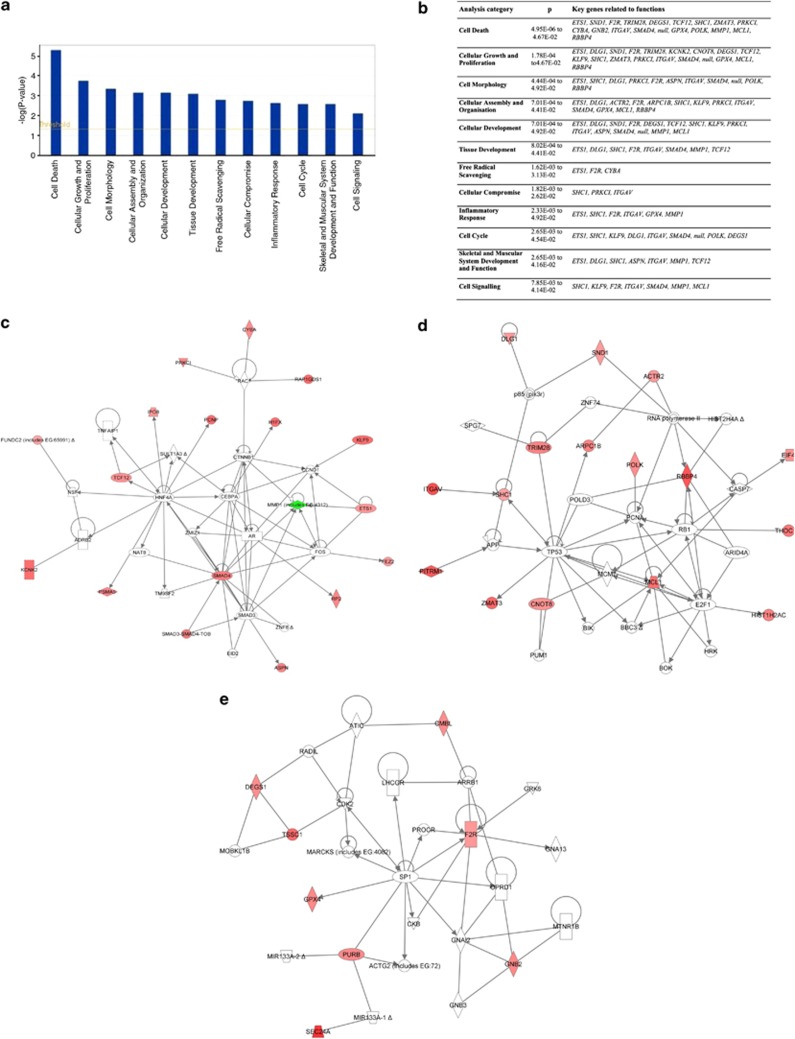
Functional analysis of the 0 h data set of genes with IPA software. (a and b) Key biological functions associated with genes that were selectively upregulated (n=52) and downregulated (n=1) in aged SCs versus young SCs before in vitro culture (0 h). The analysis revealed that the top function involved is represented by cell death. (c–e) The three top networks generated by the IPA software, showing genes selectively dysregulated in the proliferating SCs at 0 h, as shown in a and b (score range, 15–38). Genes in red show increased expression in aged SCs, whereas genes in green show decreased expression in aged SCs, when compared with young SCs. Genes in white represent the transcripts not modulated under the different conditions. Arrows indicate that a molecule acts on another, whereas lines indicate that a molecule binds to another. The gene networks show the nodes of genes involved in cell death (SMAD4, MMP1) (c), in cell death (MCL1), actin stress fibre formation (RBBP4, ITGAV), and muscle development and morphogenesis (DLG1, SHC1) (d), and in apoptotic pathways (F2R, GNB2, DEGS1) (e)

