Figure 5.
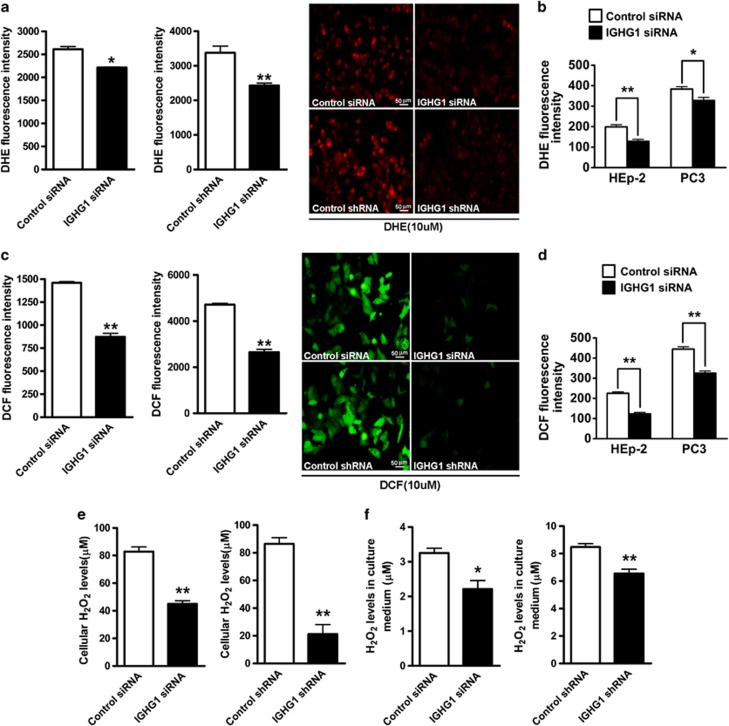
Downregulation of cancer-derived IgG-lowered cellular ROS level. (a) HeLa cells were treated with IGHG1 siRNA or scrambled siRNA for 72 h. Cells were then incubated with fluorescent probe DHE at a final concentration of 10 μM in high-glucose DMEM without FBS for 20 min at 37 °C, washed three times with serum-free medium and analyzed using a flow cytometry. For each analysis, 10 000 events were recorded. Similarly treated cells were observed with a confocal microscope. The images are shown in the right panel. Scale bar, 50 μm. (b) Similar experiments were performed for HEp-2 and PC3 cells. (c) HeLa cells were transfected with IGHG1 siRNA or scrambled siRNA for 72 h. Cells were then incubated with fluorescent probe DCFH-DA at a final concentration of 10 μM in high-glucose DMEM without FBS for 20 min at 37 °C, washed three times with serum-free medium and analyzed with a flow cytometry. For each analysis, 10 000 events were recorded. Similarly treated cells were observed with a confocal microscope. The images are shown in the right panel. Scale bar, 50 μm. (d) Intracellular ROS (H2O2) level was monitored with flow cytometry with fluorescent probe DCFH-DA in HEp-2 and PC3 cells. HeLa cells were treated with IGHG1 siRNA or scrambled siRNA for 72 h. Total lysates (e) and culture medium (f) were used to detect cellular H2O2 level respectively. Similar experiments were performed using HeLa cells stably expressing IGHG1 shRNA or control shRNA (a, c, e, and f). Data shown are the mean±S.D. of three independent experiments (*P<0.05; **P<0.01)

