Figure 3.
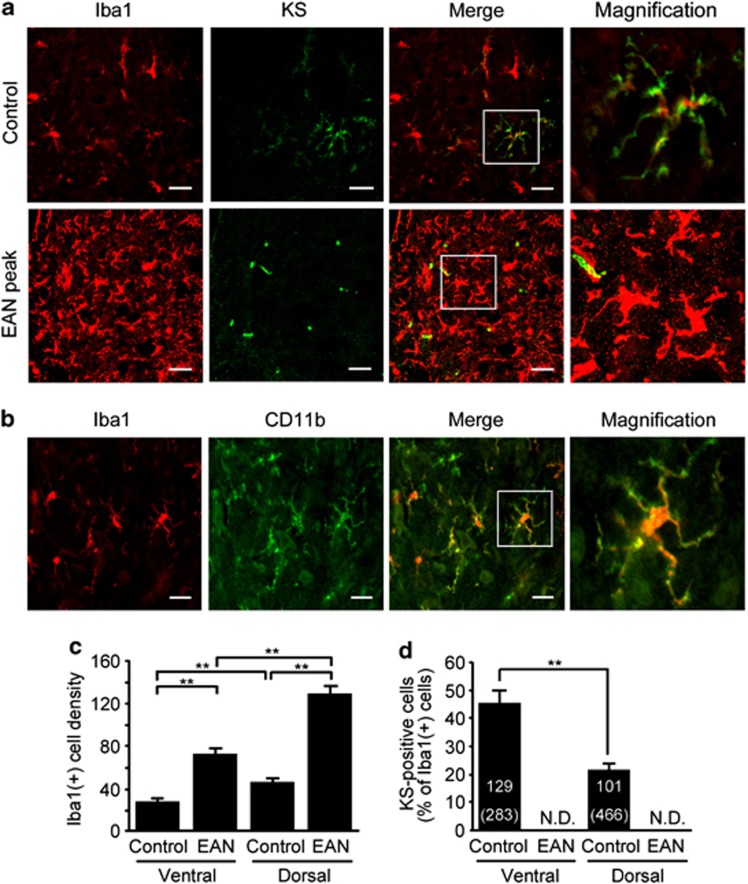
KS is specifically expressed on microglia/macrophages in the normal spinal cord. (a) The spinal cord frozen sections were from control or EAN rats and were stained with indicated antibodies. Scale bars, 20 μm. The figure shows the representative images in the dorsal horn area of control and EAN rats. (b) Iba1-positive cells were completely merged with CD11b-positive cells in the normal spinal cords. Scale bars, 20 μm. (c) The number of Iba1-positive cells was counted in the ventral and dorsal horns of the normal and EAN spinal cords (n=10). (d) The percentages of KS-positive cells were calculated in ventral and dorsal horns of the normal and EAN spinal cords. The numbers in parentheses indicate the number of microglia examined. Each column represents average±S.D. N.D., not detected. The P-value was calculated using Student's two-tailed t-test. **P<0.01

