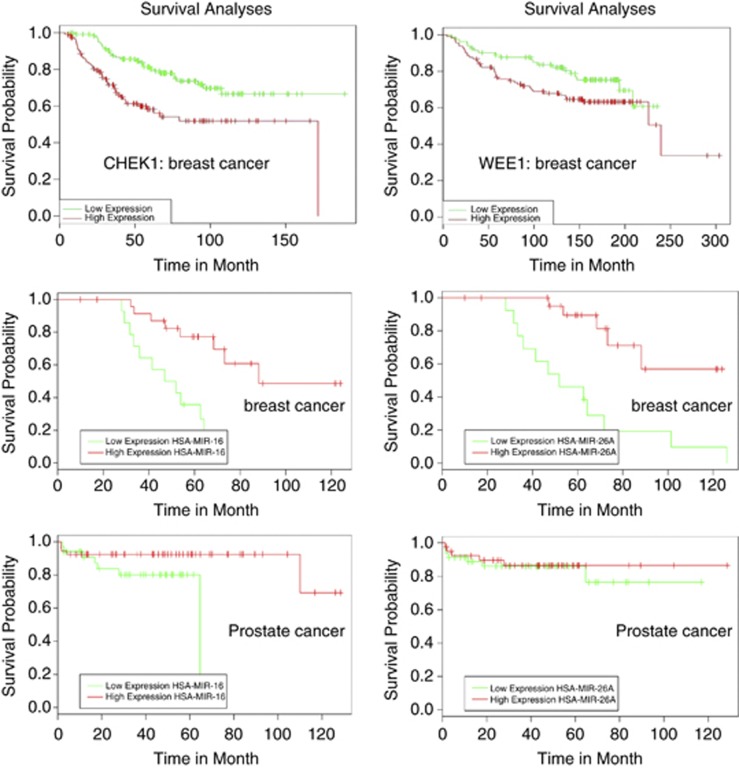
Figure 7.
A bioinformatics analysis of the effect of Chk1, Wee1, miR-16 and miR-26a expression on survival rates for both breast and prostate cancer patients. The two upper panels show correlations between the levels of expression of Chk1 and Wee1 and survival rates of breast cancer patients. The two middle and two bottom panels show correlations between miR-16 and miR-26a levels of expression and the survival rates of breast and prostate cancer patients, respectively

