Figure 6.
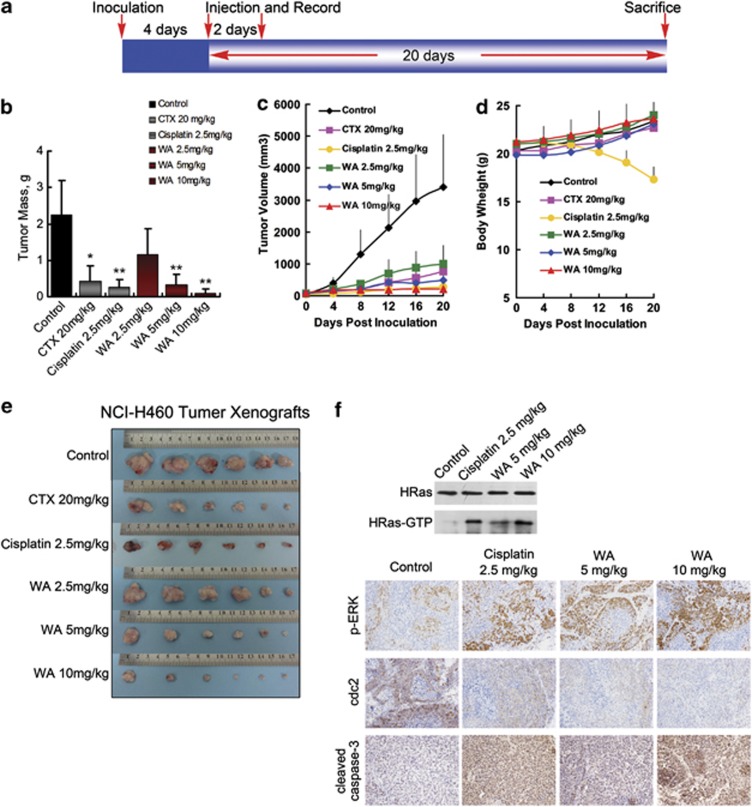
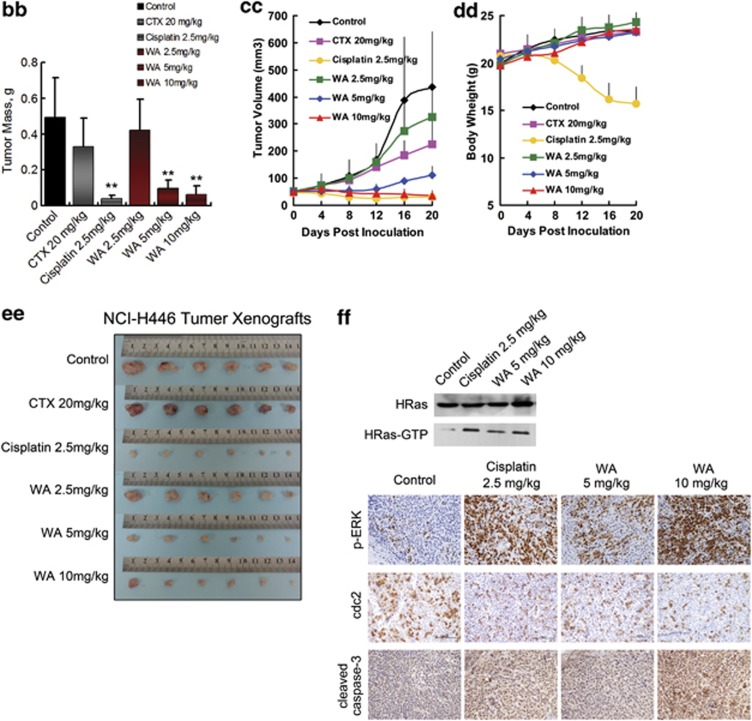
Effect of WA on tumor growth in xenograft models. Mice were treated with vehicle (1% DMSO) or drugs according to the protocol in panel (a); (b–f) and (bb–ff) are the results from NCI-H460 xenograft bearing mice and NCI-H446 xenograft bearing mice, respectively. (b and bb) Average tumor mass at sacrifice. *P<0.05, **P<0.01 versus control group. (c and cc) Transplant tumor volume after the injection. (d and dd) Body weight of nude mice. (e and ee) Tumor image from various treatment groups. (f and ff) Western blot assay for HRas, HRas-GTP and representative photomicrographs of xenograft tumor sections for IHC analysis for p-ERK, cdc2 and active caspase-3 expression ( × 200). Significantly increased HRas-GTP, p-ERK, active caspase-3 and decreased cdc2 expressions were observed in the WA-treated tumors compared with the vehicle control groups


