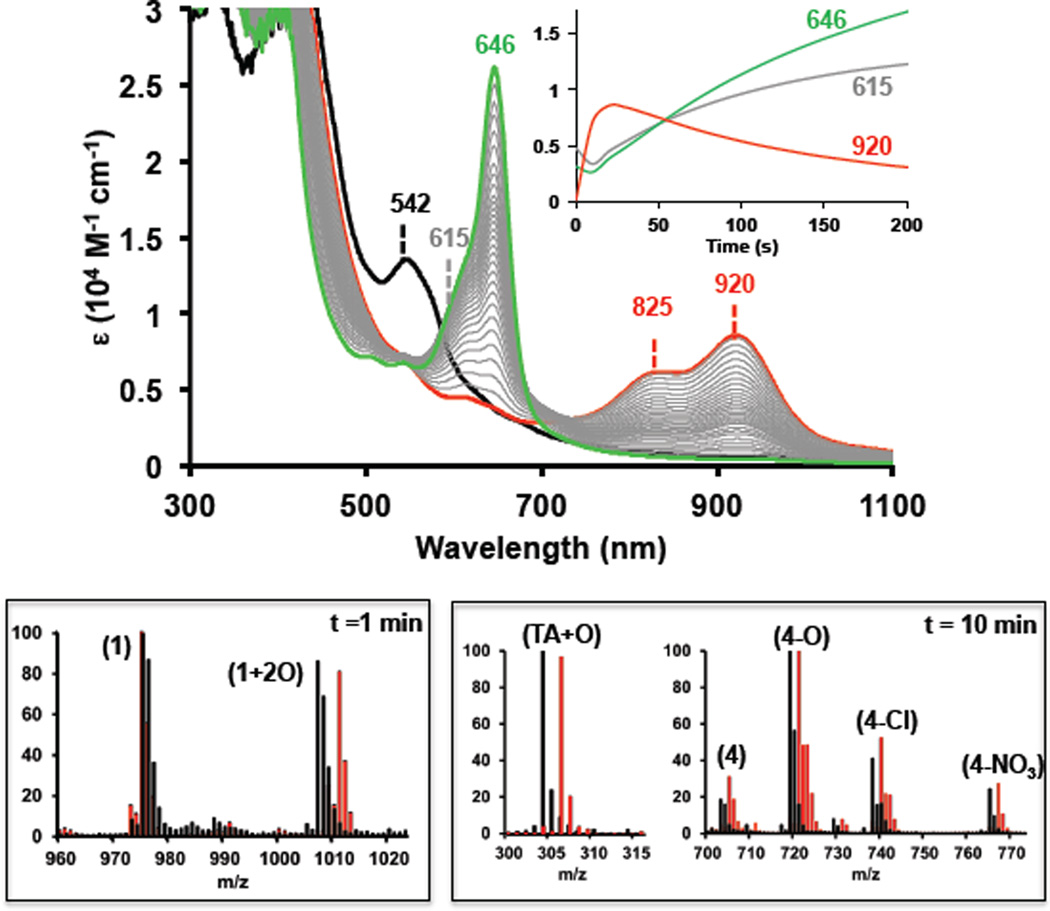
Figure 1.
Top: UV-Vis spectroscopic changes occurring during the oxidation of complex (1-OH) [0.1 mM] with CAN [40 mM]. Initial (1-OH) (black), isoporphyrin complex (2) ( ; t= 10 s) and final verdoheme-type complex (4-X) (
 ; t= 300 s). The
  spectra show the formation of a verdoheme-type complex (4-X) from the isoporphyrinic intermediate (2) via complex (3) (broad band centered at 615 nm). Inset plot: Abs. evolution over time at different wavelength values. Bottom: ESI-MS spectra for the oxidation of (1-OH) [0.1 mM] with CAN [10 mM] in CH3CN/H2O (1:1) (black) or CH3CN/H218O (1:1) mixture (
 ) after 1 min of addition of oxidant (left) and after 10 minutes (right).9

