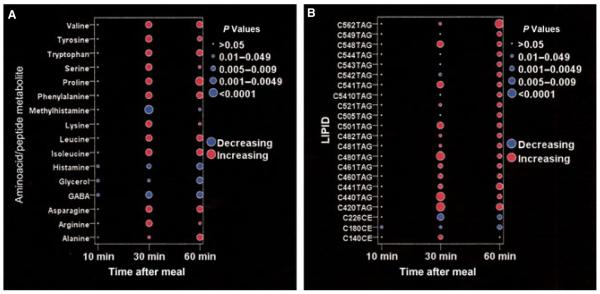
Figure 2.
Amino acid (A) and lipid (B) metabolites with significant postprandial changes. The metabolites shown exhibited a significant (P < 0.005) change in median concentration at any of the postprandial time points compared with baseline. The figure depicts the level of the metabolite as either increasing (red) or decreasing (blue), with the size of the dot reflecting the level of significance. CE: cholesterol ester; TAG: triacylglycerol; C56:2 refer to a lipid with 56 carbon molecules and 2 double bonds.

