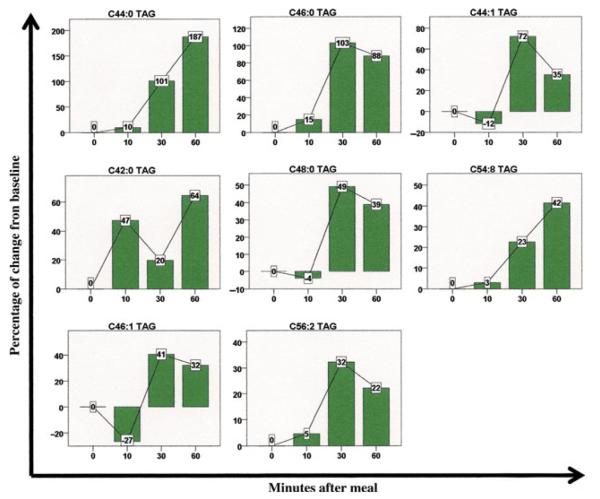
Figure 4.
Metabolic changes in lipids after meal ingestion. Eight lipids exhibited a significant postprandial change in plasma level of at least 25% compared with baseline. Data represent the entire cohort of 20 patients. Bars denote percentage change from baseline, lines connect the percentage changes, and the boxes denote the actual percentage change and its direction. TAG, triacylglycerol. C44:1 refers to a lipid chain with 44 carbon molecules and 1 double bond.

