Figure 14.

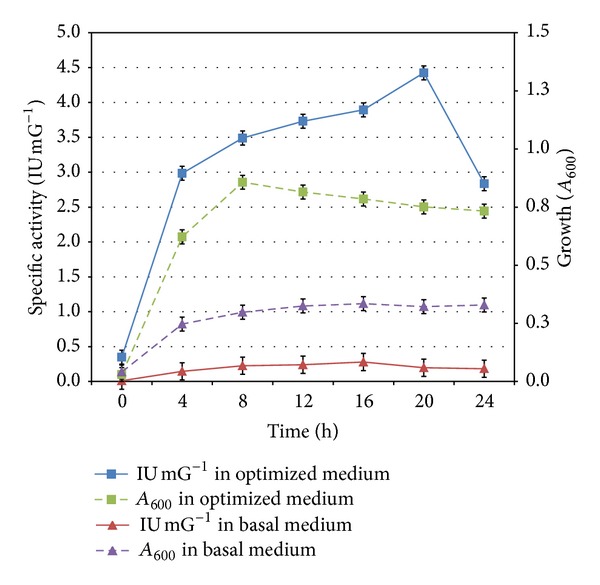
Time course of specific ADI activity and growth of E. faecium sp. GR7 in optimized and basal (TGYE) medium. Results are expressed as the mean ± S.D (n = 3), P-value <0.05.

Time course of specific ADI activity and growth of E. faecium sp. GR7 in optimized and basal (TGYE) medium. Results are expressed as the mean ± S.D (n = 3), P-value <0.05.