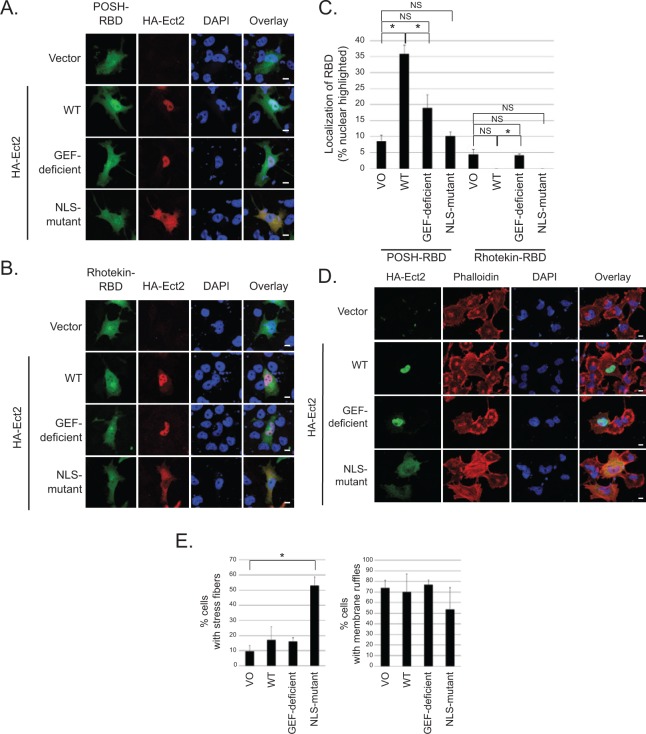
Figure 7.
Ect2 recruits downstream effectors of Rac to the nucleus and initiates canonical RhoA signaling in the cytoplasm. To determine if Ect2 was capable of activating endogenous Rho GTPases in the nucleus, we examined GFP-RBD recruitment in OVCAR8 cells expressing empty vector versus exogenous HA-tagged WT, GEF-deficient, or NLS-mutant Ect2. Confocal immunofluorescence microscopy was used to image cells expressing both HA-Ect2 (red) and each GFP-RBD (green); nuclei were stained using DAPI (blue). (A) Ect2 recruits POSH-RBD to the nucleus in a GEF-dependent manner. POSH is a Rac-specific effector, and recruitment of POSH-RBD reveals endogenous Rac activation in the nucleus (n = 7, with an average of 40 cells/condition in each replicate). Scale bars represent 10 µm. (B) Ect2 does not recruit Rhotekin-RBD to the nucleus. Rhotekin is a Rho-specific effector that was not detectably recruited (n = 6, with an average of 30 cells/condition in each replicate); see Results section. Scale bars represent 10 µm. (C) Ect2 recruitment of POSH to the nucleus is robust and statistically significant. Quantification of GFP-RBD localization was performed for each condition, as described in Materials and Methods. The percentage of cells with nuclear-highlighted expression of the GFP-RBD is shown (*P < 0.05 difference from vector with Bonferonni correction; error bars represent SEM). (D) NLS-mutant Ect2 enhances stress fiber formation but not membrane ruffling. Extra-nuclear Rho GTPase signaling was investigated by examining the actin cytoskeleton. Canonical RhoA signal transduction induces stress fiber formation, whereas Rac1 drives membrane ruffling. We compared organization of the actin cytoskeleton in OVCAR8 cells expressing empty vector versus exogenous HA-tagged WT, GEF-deficient, or NLS-mutant Ect2. Confocal immunofluorescence microscopy was used to image cells expressing HA-Ect2 (green, Covance); actin was stained using Alexa Fluor 568-conjugated phalloidin (red, Invitrogen, Grand Island, NY), and nuclei were stained using DAPI (blue). (E) Cells expressing each construct as shown in panel D were quantified for presence or absence of stress fibers or membrane ruffles (n = 3, with an average of 35 cells/condition in each replicate). Statistical significance was evaluated using Student’s t-test, with the Bonferonni correction (*P < 0.05); error bars represent standard error (SEM).

