
Figure 1.
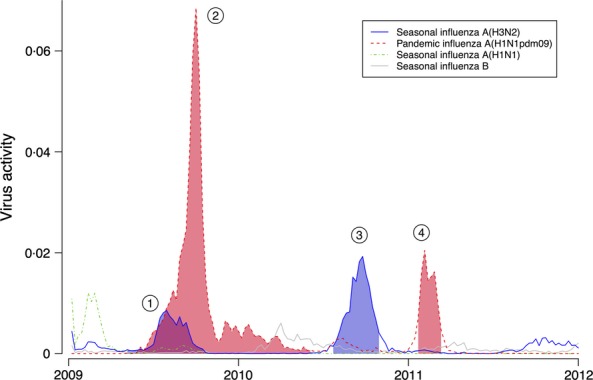
Type-/subtype-specific weekly influenza virus activity in Hong Kong from 2009 through 2011. Influenza virus activity was estimated by the weekly proportion of consultations for influenza-like illness at sentinel clinics multiplied by the weekly virus detection rate (by type/subtype) in the local public health laboratory. Shaded areas indicate the four influenza epidemics that occurred in Hong Kong from the emergence of influenza A(H1N1pdm09) virus through to the end of 2011.  Epidemic of the seasonal influenza A(H3N2) virus in 2009 (blue area);
  Epidemic of influenza A(H1N1pdm09) virus epidemic in 2009–2010 (red area);
  Post-pandemic epidemic of the seasonal influenza A(H3N2) virus in 2010 (blue area); and
  Second epidemic of influenza A(H1N1pdm09) virus epidemic in 2011 (red area).