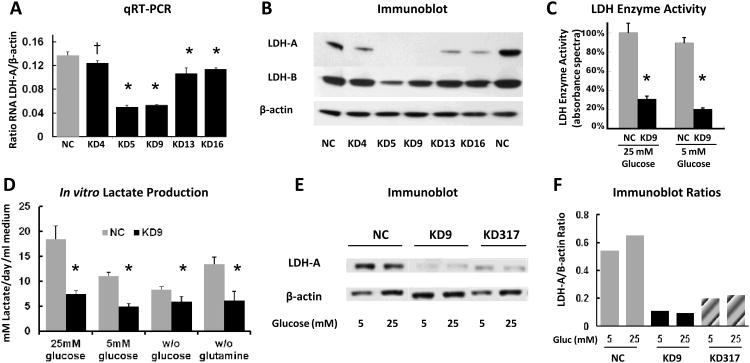
Figure 1. Selection and characterization of LDH-A knockdown cells.
(A) qRT-PCR analysis of LDH-A mRNA expression in the 4T1 cell lines transfected with scrambled shRNA (NC, control) and shRNA to mouse LDH-A mRNA (KD, knockdown) n=3. P values for KD4, KD5, KD9, KD13 and KD16 cells were p=0.03, p<0.0001, p<0.0001, p<0.01 and p<0.01, respectively (*: p<0.01; †: p<0.05). (B) Western blot analyses on whole cell lysates prepared from NC and KD clones. (C) Total LDH enzyme activity in NC and KD9 cells cultured in DMEM with 25 mM or 5 mM glucose, 6 mM L-glutamine and 10% FCS) (* p<0.01). (D) Lactate production: appearance of lactate in different culture medium between NC and KD9 cells (* p<0.01 comparing NC and KD9 cells). (E) Western blot analysis of LDH-A expression: cells were grown in DME media with 5 or 25 mM glucose, and whole cell lysates were analyzed for LDH-A, and β-actin expression. (F) LDH-A/β-actin proteins bands ratio were assessed by ImageJ software.

