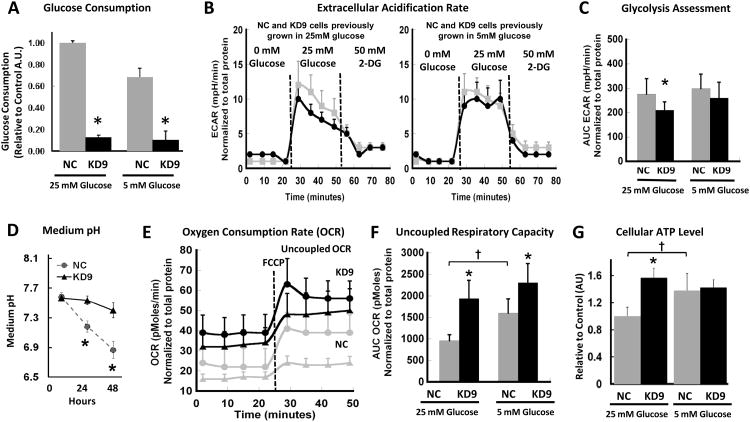
Figure 2. Metabolic properties of NC and KD9 cells in vitro.
(A) Glucose consumption: Cell culture media (standard DMEM with 5 or 25 mM glucose) was assayed for Glucose following 48 hours incubation. Fluorescence intensity was normalized to the number of viable cells and background fluorescence (* p<0.01). (B) Extracellular Acidification Rate (ECAR): measurements were obtained prior to and after injection of glucose (initiate glycolysis) and 2-DG (block glycolysis), sequentially. A typical experiment is shown. (C) Glycolysis Assessment calculated from ECAR results (Panel B) for cells previously growing in 25 and 5 mM glucose-containing media; the mean ECAR area under the curve (AUC; mpH/min) (* p<0.01 comparing NC and KD9 cells) normalized to total protein (μg). (D) Cell culture medium acidification during NC and KD9 cell growth in standard DMEM with 25 mM glucose (* p<0.01). (E) Oxygen consumption rate (OCR) and the maximal mitochondrial capacity of cells cultured in 25 mM (triangles) and 5 mM (circles) glucose-containing media. FCCP (carbonyl cyanide p-trifluoro methoxy phenylhydrazone) was used as a potent uncoupler of oxidative phosphorylation in mitochondria. (F) The uncoupled respiratory capacity was calculated from Panel E results: AUC OCR (pMoles) (* p<0.01 comparing NC and KD9 cells; † p< 0.01 comparing NC cells in 25 vs 5 mM glucose-containing media). (G) ATP levels were measured in cells growing in standard DMEM containing 25 or 5 mM glucose; results were normalized to the number of viable cells, and corrected for background luminescence (* and † p<0.01).

