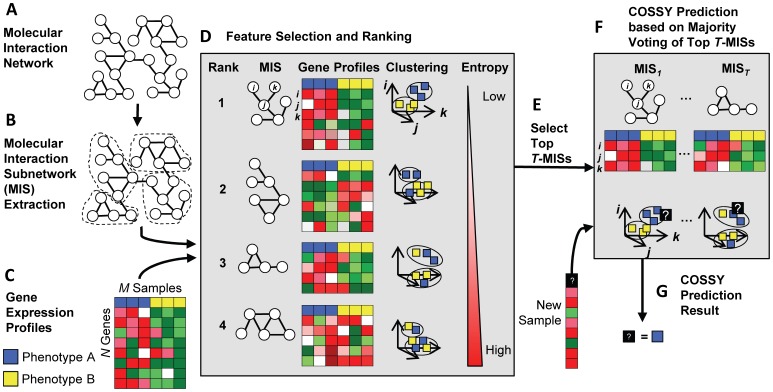
Figure 1. Overview of COSSY.
Communities are extracted from the molecular interaction network to generate Molecular Interaction Subnetworks (MISs)(A–B). Each MIS is mapped to microarray probes and all the samples are clustered according to the expression pattern of a certain number of highly differentially expressed probes (3 probes in this example figure). MISs are ranked by the entropy score which is lowest when every cluster contains only one type (phenotype) of samples (C–D). Finally, the top  MISs cast votes to predict the context (phenotype) of a new sample. The voting depends on the proportion of different types of samples in the cluster closest to the new sample (E–G).

