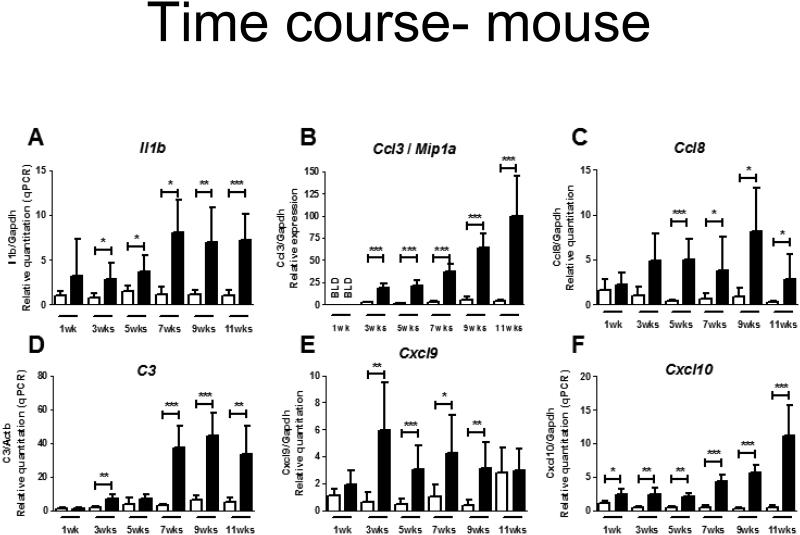
Figure 1. Validation of mouse inflammation PCR array results.
qPCR validation of 6 genes in Npc1+/+ (white columns) and Npc1−/− (black columns) cerebral cortex. One-week-old control mice were used as reference group for the relative quantitation, except for Ccl3 for which the 3-week-old control group was used as 1-week-old mice had undetectable transcript levels (BLD: below limit of detection). Mean and standard deviation are shown for each group (N=4). An unpaired t-test with Welch’s correction, when necessary, was performed to determine the significance of the difference in means between the log10 values of control and mutant mice relative quantitation at each age: * p-value ≤ 0.05; ** p-value ≤ 0.005; *** p-value ≤ 0.0001.

