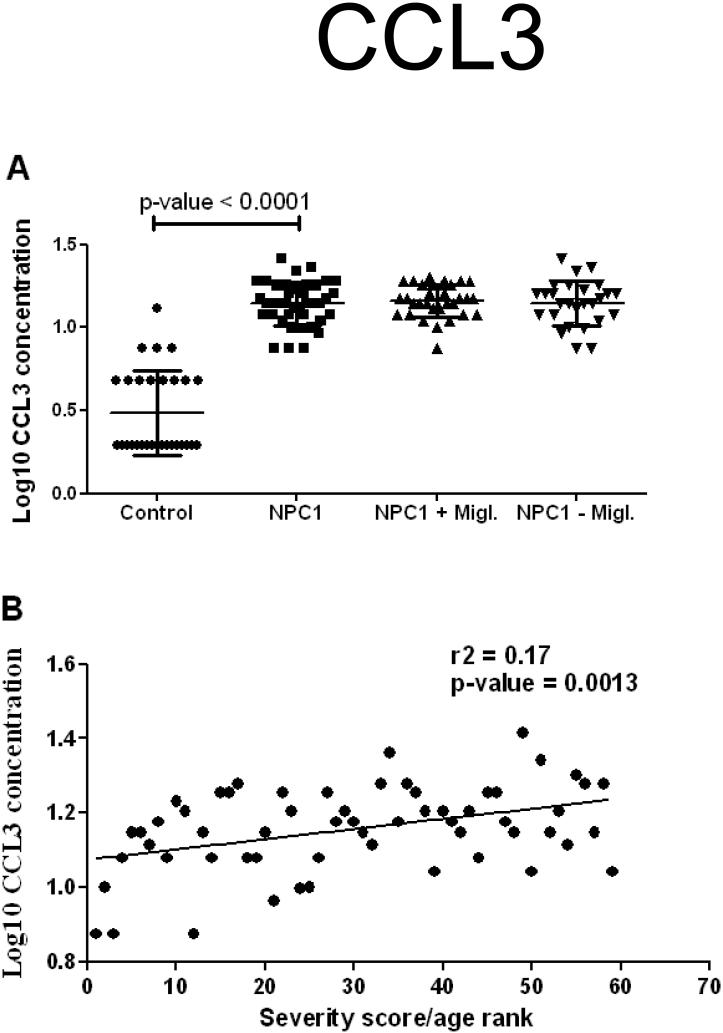
Figure 4. CCL3 marker.
(A) Log10 transformed concentrations of CCL3 in cerebrospinal fluid from controls (circles) and NPC1 patients (squares). The patient group was additionally separated between patients receiving miglustat treatment (triangles), and patients not receiving miglustat treatment (inverted triangles). Mean and standard deviation are shown for each group. An unpaired t-test with Welch’s correction when necessary was performed to determine the significance of the difference in means between controls and patients. (B) Correlation of CCL3 concentrations in cerebrospinal fluid with patient annual severity increment score (severity score divided by their age) followed by numerical ranking (ie., 1 to 59 representing least to most severe phenotype).

