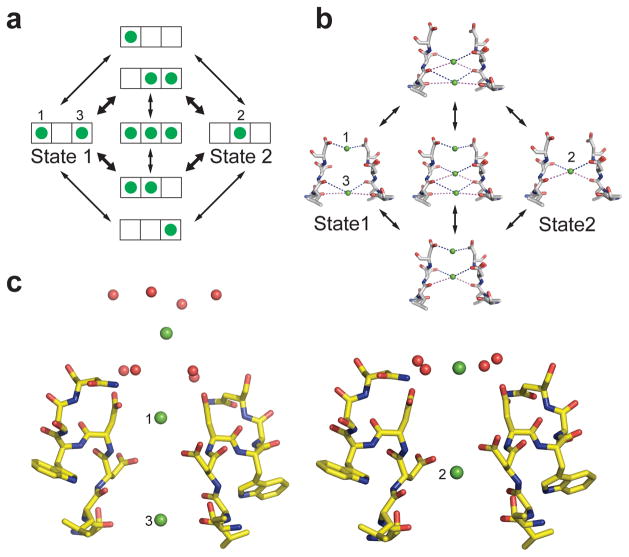
Figure 4. Catalytic cycle for Ca2+ conductance by CaVAb.
a, An ionic occupancy state diagram of CaVAb showing two proposed low energy states and the potential transitions that connect them. Each state of the selectivity filter is represented by a three-box rectangle with Sites 1 – 3 going from left to right. Green circles represent Ca2+ ions. Note that transitions in the inner circle potentially lead to ion repulsion, which might facilitate conduction. These transitions in the inner circle are more probable than those in the outer circle, as denoted by the bold arrows. b, The structural basis of the ionic occupancy states depicted in the inner circle of the state diagram shown on the left. The clockwise cycle represents a path for inward flux of Ca2+ ions through the selectivity filter. c, Coupling of extracellular Ca2+ binding sites and the three sites within the selectivity filter in the two proposed ionic occupancy states. When two Ca2+ ions bind to position 1 and 3 in the filter, the entryway Ca2+ ion is placed furthest from the pore (left). When one Ca2+ ion binds to position 2 within the filter, the ion outside the filter is pulled closer to the pore (right).

