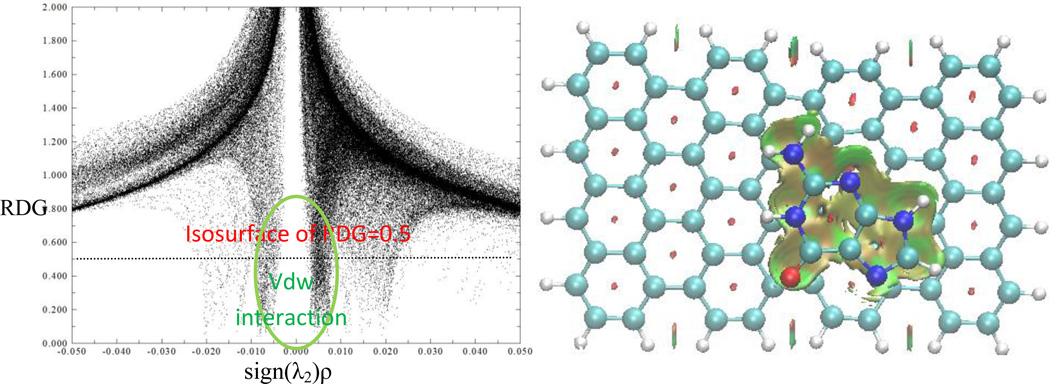
Figure 7.
The scatter plot of RDG vs sign(λ2)ρ (left), and color filled sign(λ2)ρ at the isosurface of RDG=0.5. It has the same color code as in Figure 3. Green and yellow areas show the vdW interaction between guanine and the mono-vacant graphene through π⋯ π, C=O⋯ π, and N/C-H⋯ π.

