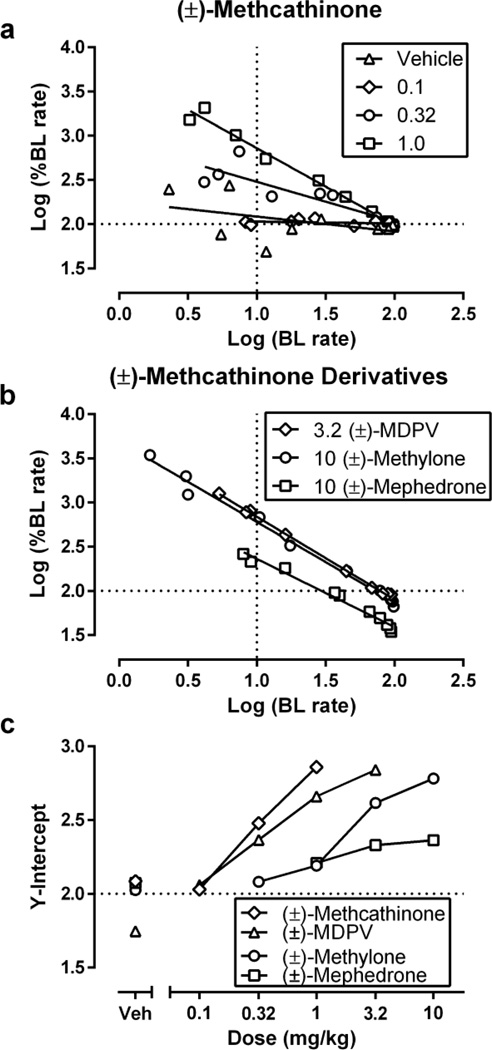
Fig. 4.
Rate-dependency analysis of methcathinone and its derivatives effects on ICSS. (a, b) Abscissae: log baseline ICSS rate. Ordinates: log percent baseline ICSS rate. Horizontal line at Y=2.0 indicates no change from baseline rates. Vertical line at X=1.0 indicates the position of the Y-intercept values used in Panel c. (c) Abscissa: drug dose in mg/kg. Ordinate: Y-intercept from linear regression analysis of rate-dependency plots. All points show mean data for 5–6 rats.

