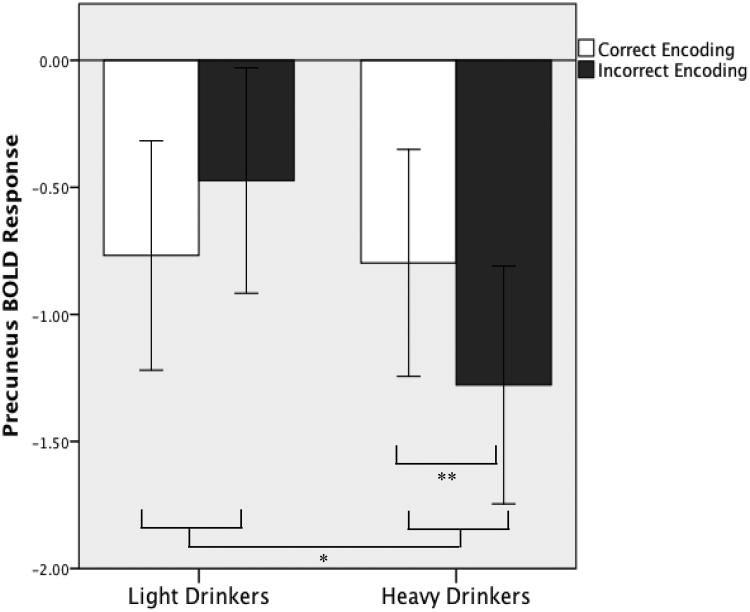
Figure 3.
Average precuneus BOLD contrasts during correct and incorrect encoding, where heavy drinkers showed enhanced deactivation during incorrect encoding. BOLD response is averaged from an 8 mm sphere around the peak MNI coordinate, -3, -79, 42. Error bars represent +/- 1 standard error.
* Significant group by encoding condition interaction, p < .05
** Significant difference between encoding conditions, p < .05

