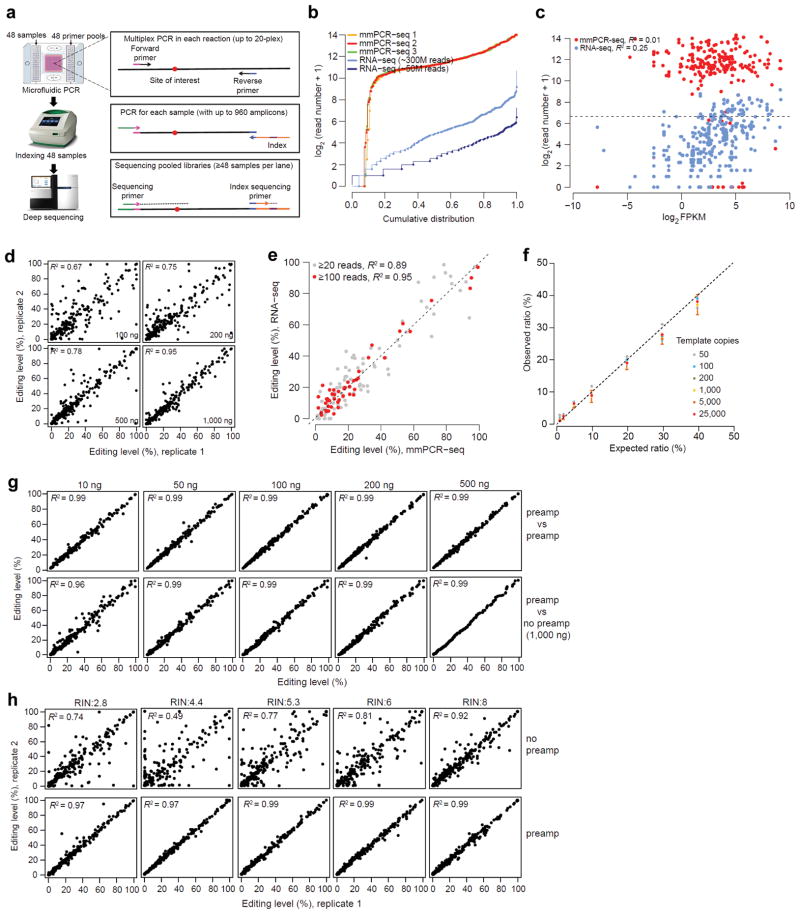
Figure 1.
The development and performance of mmPCR-seq. (a) Schematic diagram of mmPCR-seq. (b) Uniformity of different amplicons. 240 RNA editing loci were amplified using 1 ug of HBRR cDNA sample. Read numbers of three technical replicates were normalized to 0.8 million mapped reads per sample. The coverage of the same sites from RNA-seq data (both the 300 M full set and the 50 M subset) was also shown. (c) Relationship between the coverage of individual sites and the gene expression levels reported in Fragments Per Kilobase of transcript per Million mapped reads (FPKM). For mmPCR-seq, the average depth of three technical replicates was shown. The Pearson correlation coefficient (R2) was indicated. (d) Relationship between the reproducibility of RNA editing measurements in technical replicates and the amount of cDNA input. A full description of comparison among three technical replicates is shown in Supplementary Fig. 3. (e) Comparison of editing levels measured by mmPCR-seq and RNA-seq. Sites with at least 20 or 100 reads in RNA-seq were used, respectively. (f) The comparison between expected allelic ratio and observed ratio measured by mmPCR-seq. The observed allelic ratio is the average of 6 sites. Different amounts of templates (copies of molecules per PCR reaction) were indicated in different colors. Standard deviation for 1,000 copies of template was shown as an example. A full description of comparison is shown in Supplementary Table 2. (g) Reproducibility of editing level measurement using pre-amplified cDNAs. Top row: technical replicates using pre-amplified samples. Bottom row: the pre-amplified cDNA versus the un-amplified 1,000 ng of cDNA. (h) Reproducibility of RNA editing level measurement in technical duplicates using low quality RNA samples, without (top row) and with (bottom row) preamplification. RNA integration number (RIN) was indicated. For un-amplified samples, 1,000 ng of cDNA was used. For pre-amplified samples, 200 ng of cDNA was used.

