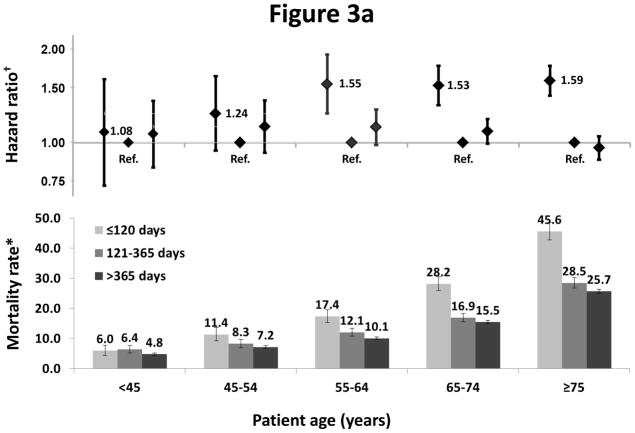
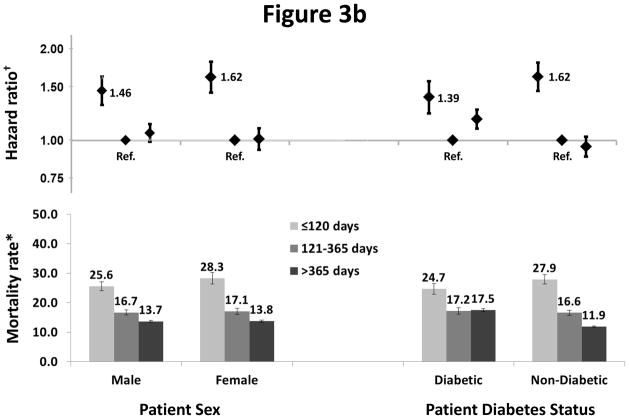
Figure 3.
Figure 3a: Association of mortality with age and vintage
†One model was fitted to each patient subgroup based on age at study enrollment (<45, 45–55, 55–64, 65–74, ≥75 years)
Models were adjusted for age, sex, race, and diabetes as cause of ESRD, stratified by countries and study phase, and accounted for facility clustering.
*Mortality rate: unadjusted number of deaths per 100 patient-years. Error bars correspond to 95% confidence intervals calculated using the Byer approximation.
Figure 3b: Association of mortality with sex, diabetes status, and vintage
†One model was fitted to each patient subgroup based on sex or diabetes status at study enrollment
Models were adjusted for age, sex, race, and diabetes as cause of ESRD, stratified by countries and study phase, and accounted for facility clustering.
*Mortality rate: unadjusted number of deaths per 100 patient-years. Error bars correspond to 95% confidence intervals calculated using the Byer approximation.


