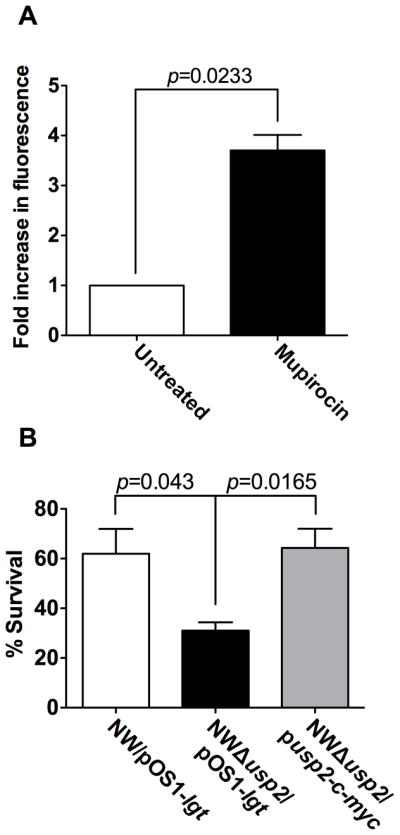
Figure 5. Expression of usp2 is induced during the stringent response.

(A) The usp2 promoter was fused to GFP and fluorescence was used as a measurement of usp2 expression when exposed to mupirocin at a final concentration of 60 μg ml-1. The data are presented as fold increase in fluorescence as compared to the reporter exposed to the vehicle control. The data presented are the average of three independent experiments each performed in triplicate, and the error bars represent the standard error. B) Bacterial survival assay: wildtype NW/pOS1-lgt, NWΔusp2/pOS1-lgt and NWΔusp2/pusp2-c-myc were incubated with or without 120 μg ml-1 mupirocin and the percent survival was calculated by considering the number of bacteria present in the absence of mupirocin as 100%. The data presented are the average of three independent experiments each performed in triplicate, and the error bars represent the standard error. Student’s t test was used to calculate p values.
