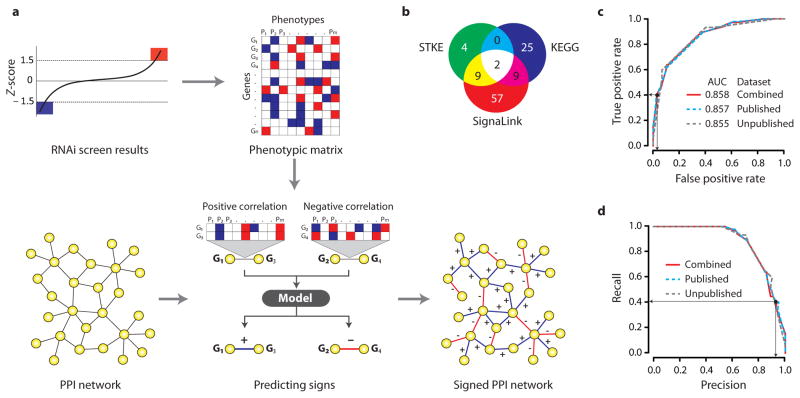
Figure 1.
Framework to predict the signs of protein interactions. (a) Schematic representation of the framework. (b) Sources of signaling PPIs with known edge signs. (c) ROC plot and (d) precision-recall curve shows the performance of the sign prediction model. Black dots and the arrows show the chosen Sscore cutoff (Sscore ≥ 1 or Sscore ≤ −1).

