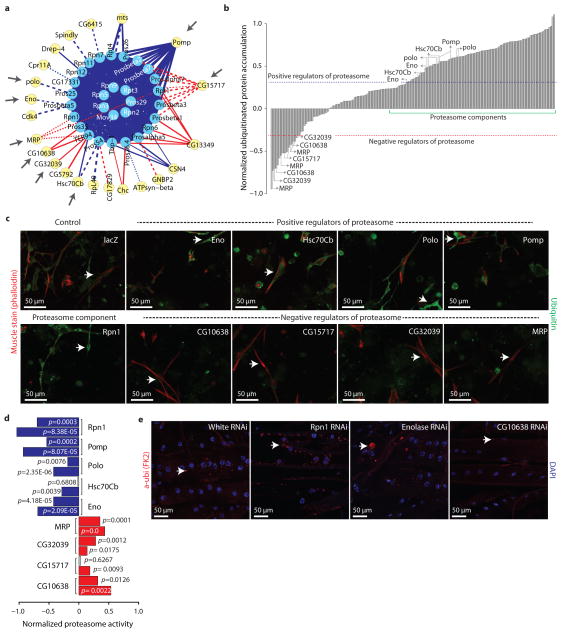
Figure 4.
Validation of predicted proteasome regulators. (a) Sub-network of proteasome complex (as in Figure 3). Grey arrows highlights subsequently validated proteins. (b) Results from the image-based RNAi screen measuring the accumulation of ubiquitinated proteins in primary muscle cells in which regulators shown in (a) has been knocked down with RNAi. Blue and red dotted-lines indicated the cut-off values used for positive and negative regulators, respectively. Green line highlights region corresponding to most proteasome core components. (c) Micrographs show muscle cells stained with phalloidin (red) and α-ubiquitin (green), in which the indicated candidate regulator has been knocked down with RNAi. Arrows point to ubiquitinated proteins in cells. (d) Enzymatic activity of the proteasome upon the indicated RNAi treatment in S2R+ cultured cells. Blue and red bars corresponds to significant reduction and increase in proteasome activity, respectively. Independent RNAi reagents are shown for each gene. (e) Micrographs show 3rd instar larval longitudinal muscles expressing the indicated RNAi hairpins under control of the muscle-specific driver line Dmef2-Gal4 (red=phalloidin, blue=DAPI). Arrows point to ubiquitin-labeled aggregates.

