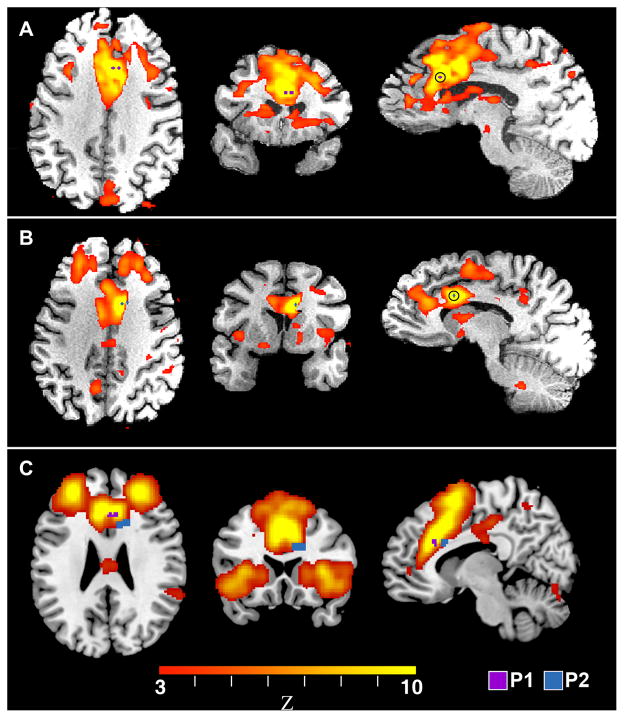
Figure 2. Functional Connectivity Analyses of the Stimulation Sites Identify the EBS Target Sites as Part of the Emotional Salience Network.
Panels A and B show the functional connectivity network derived by seeding a small region-of-interest (ROI) centered between electrodes 1 and 2 in patients P1 and P2, respectively. The ROI is indicated in blue for P1 and purple for P2. These results are presented in standard MNI space with the right side of the image corresponding to the right side of the brain. A goodness-of-fit analysis, comparing the networks in A and B to a set of 14 previously characterized networks, found that each patient’s network best matched the “emotional salience” network. Panel C shows the location of the electrodes in P1 and P2 overlaid onto the standard emotional salience network derived from a group of normal human subjects (Shirer et al., 2012b).

