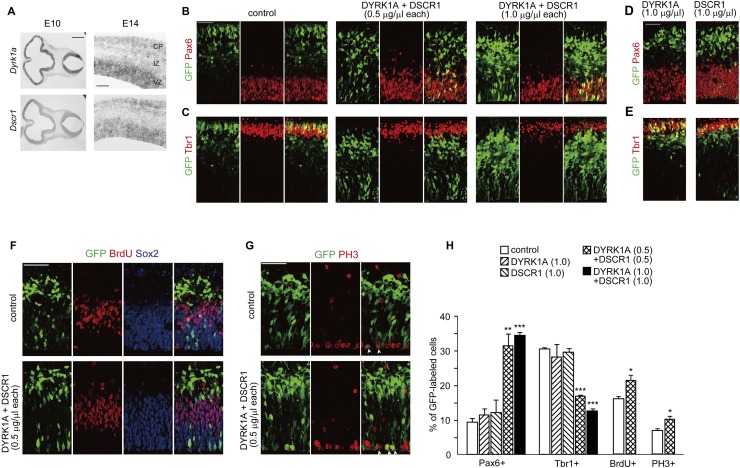
Figure 1.
Overexpression of DYRK1A and DSCR1 results in decreased cortical progenitor differentiation. (A) Expression of Dyrk1a and Dscr1 in the developing brain. In situ hybridization analyses with Dyrk1a and Dscr1 probes were carried out on sections of E10 embryos and E14 brains. Images of the horizontal sections of E10 embryos (left panels) and coronal sections of E14 neocortices (right panels) are shown. Bars: in E10 sections, 500 μm; in E14 sections, 200 μm. (B–E) Plasmids encoding DYRK1A and/or DSCR1 were electroporated, together with the GFP-expressing plasmid, in E11 embryos. Thereafter, the E13 brain sections were immunostained with antibodies against Pax6 (B,D) and Tbr1 (C,E). Images of the entire cerebral wall are shown. Plasmids were electroporated, and their concentrations are indicated above the images. Bar, 50 μm. (F,G) Plasmids encoding DYRK1A and DSCR1 were electroporated, together with the GFP-expressing plasmid, in E11 embryos. BrdU was administrated at E12, and brains were fixed 30 min after the BrdU pulse labeling. The brain sections were then immunostained with antibodies against GFP, BrdU, and Sox2 (F) and phospho-Histone H3 (PH3) (G). Images of the entire cerebral wall are shown. Plasmids were electroporated, and their concentration are indicated. Bars, 50 μm. (H) Quantification of a fraction of GFP-positive cells that was also positive for Pax6, Tbr1, BrdU, and PH3. Data are presented as mean ± SEM (n = 3–4 embryos for each group). (*) P < 0.05; (**) P < 0.01; (***) P < 0.001 versus control by a two-tailed Student's t-test. The concentration of electroporated plasmids for DYRK1A and DSCR1 (in micrograms per microliter) is presented in brackets.

