Figure 4.
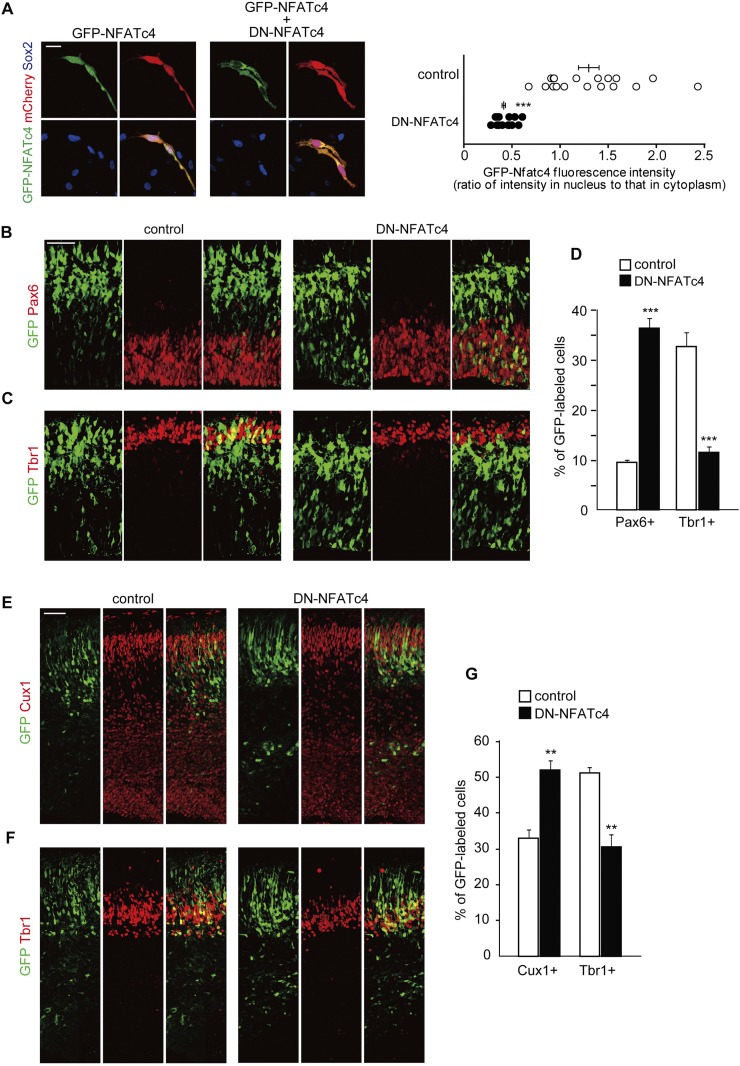
Interfering with NFATc activity impairs normal neuronal differentiation. (A) Plasmids expressing DN-NFATc4, together with plasmids encoding GFP-NFATc4 and mCherry, were electroporated in E14 embryos. Neocortical cell cultures were then prepared from the E15 brains. At DIV2, neocortical cells were treated with ionomycin (final concentration, 2 μM) for 1 h, fixed, and immunostained with antibodies against GFP (green) and Sox2 (blue). Representative images are shown. Bar, 20 μm. GFP fluorescence intensity of the nucleus and cytoplasm in individual GFP-labeled cells was measured, and the ratio of the intensity values is plotted on the right. (***) P < 0.001 versus control by a two-tailed Welch's t-test. (B–G) A plasmid expressing either control or DN-NFATc4 was electroporated, together with the GFP-expression plasmid, in E11 embryos, and the E13 (B–D) and E16 (E–G) brain sections were immunostained with the various antibodies indicated. (B,C) E13 brain sections immunostained with antibodies against Pax6 (B) and Tbr1 (C). Images of the entire cerebral wall electroporated with control (left panels) or DN-NFATc4 (right panels) are shown. Bar, 50 μm. (D) Quantification of a fraction of GFP-positive cells that was also positive for Pax6 and Tbr1. (***) P < 0.001 versus control by a two-tailed Student's t-test. (E,F) E16 brain sections immunostained with antibodies against Cux1 (E) and Tbr1 (F). Images of the entire cerebral wall electroporated with control (left panels) or DN-NFATc4 (right panels) are shown. Bar, 50 μm. (G) Quantification of a fraction of GFP-positive cells that was also positive for Cux1 and Tbr1. (**) P < 0.01 versus control by a two-tailed Student's t-test. In the graphs, data are presented as mean ± SEM (n = 3–5 embryos for each group).

