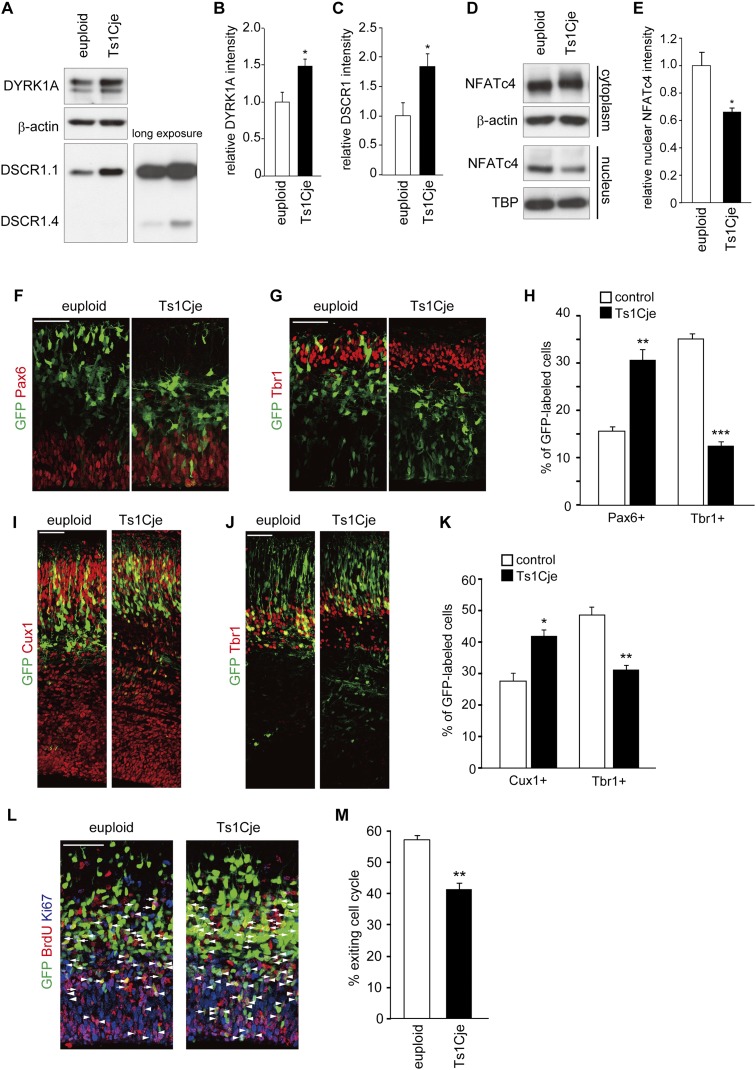
Figure 6.
Alteration of DYRK1A/DSCR1 levels, NFATc activity, and neuronal differentiation in neocortical progenitors in Ts1Cje mice. (A–E) Whole-cell lysates (A), cytoplasmic fractions, and nuclear fractions (D) of the E13 neocortex of Ts1Cje mice and euploid littermates were subjected to immunoblotting with the antibodies indicated. (TBP) TATA-binding protein. The quantified band intensity was plotted in B, C, and E (mean ± SEM; n = 4 for euploid; n = 3 for Ts1Cje). The mean values of the band intensities of euploid mice were set to 1. (F–K) The plasmids expressing GFP were introduced into E11 embryos of Ts1Cje and euploid littermates, and the E13 (F–H) and E16 (I–K) brain sections were immunostained with the various antibodies indicated. (F,G) E13 brain sections immunostained with antibodies against Pax6 (F) and Tbr1 (G). Images of the entire cerebral wall are shown. Bars, 50 μm. (H) Quantification of a fraction of GFP-positive cells that was also positive for Pax6 and Tbr1. Data are presented as mean ± SEM (n = 3 embryos for each group). (**) P < 0.01; (***) P < 0.001 versus control by a two-tailed Student's t-test. (I,J) E16 brain sections immunostained with antibodies against Cux1 (I) and Tbr1 (J). Images of the entire cerebral wall are shown. Bars, 50 μm. (K) Quantification of a fraction of GFP-positive cells that was also positive for Cux1 and Tbr1. Data are presented as mean ± SEM (n = 3 embryos for each group). (*) P < 0.05; (**) P < 0.01 versus control by a two-tailed Student's t-test. (L) The plasmids expressing GFP were introduced into E13 embryos of Ts1Cje and euploid littermates. BrdU was administrated at E14, and the brains were fixed 24 h after the BrdU administration. Brain sections were then stained with antibodies against BrdU, Ki67, and GFP. GFP-positive cells labeled with both BrdU and Ki67 (arrowheads) are progenitor cells remaining in the cell cycle. GFP-positive cells labeled with BrdU but not Ki67 (arrows) are cells that exited the cell cycle. Bar, 50 μm. (M) Cell cycle exit index. Data are presented as mean ± SEM (n = 3 embryos for each group). (**) P < 0.01 versus euploid by a two-tailed Student's t-test.

