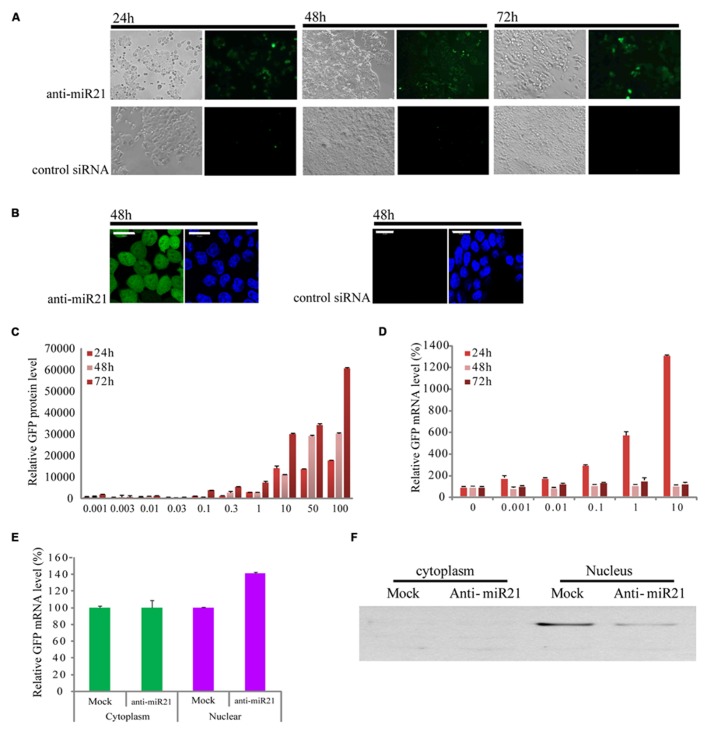
FIGURE 1.
Effect of anti-miR21 on miR21 activity. (A) Bright field images of HCT116-GFP cells that were transfected with anti-miR21 or control siRNA and grown for the indicated times. (B) left, confocal microscopy image of HCT116-GFP cell 48 h after transfection with anti-miR21. Hoechst33342 stain (blue) indicates nuclei. right, confocal microscopy image of HCT116-GFP cell 48 h after transfection with control siRNA. (C) Relative GFP fluorescence of HCT116-GFP cells transfected with anti-miR21 (0.001–10 nM). Values represent mean ± SD (n = 3) from three independent experiments. (D) Quantitative GFP mRNA levels (normalized by GAPDH), determined by Q-PCR, in HCT116-GFP cells transfected with anti-miR21 (0.001–100 nM). (E) GFP mRNA levels in nuclear and cytoplasmic extracts of HCT116-GFP cells transfected with control siRNA and anti-miR21. MiRNA levels were determined as described in (D). (F) Confirmation of separation of nuclear and cytoplasmic fractions. Aliquots containing 30 μg of total protein from cytoplasm and nuclear extracts were separated by 12% SDS-PAGE gel, transferred onto nitrocellulose membrane, and probed with antibodies specific for the nuclear protein fibrillarin.

