FIGURE 4.
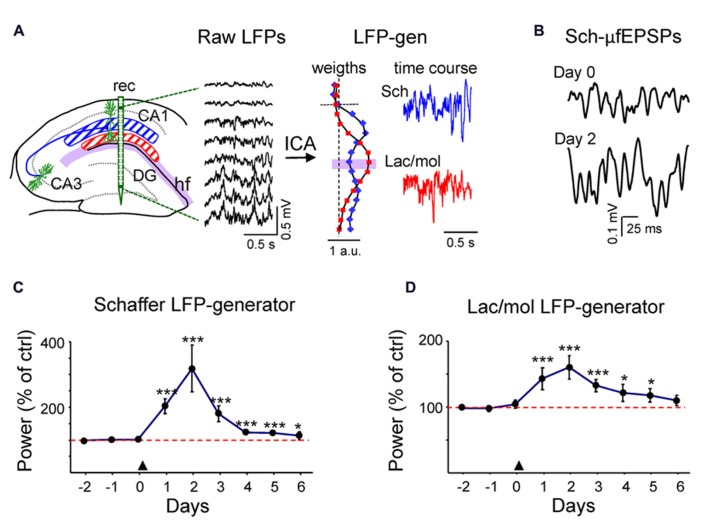
In vivo transient increment of ongoing activity in synaptic inputs to CA1. (A) Hippocampal raw LFPs recorded in depth profiles by linear probes (rec in left scheme). Only every other site is represented. The ICA analysis of linear raw LFPs rendered two main LFP generators in the CA1 region, one centered in the striatum radiatum or Schaffer-LFP generator (blue) and other in the striatum lacunosum-moleculare (lac/mol generator; in red). Each had a characteristic spatial distribution (see normalized relative spatial weight in vertical plots), while the temporal activation was specific to the epoch analyzed (color traces to the right). The baseline activity of the Schaffer LFP generator consists of a regular succession of small field potential wavelets at gamma frequency termed μ-fEPSPs [enlargement in (B)]. (C,D) LFP activity was recorded during the three days prior to PTD4-PI3KAc injection (marked by an arrowhead at day zero) and for 6 days afterwards. The power of an LFP generator estimates the magnitude of the ongoing synaptic input from a specific afferent pathway to the target population (CA1 pyramids). It was calculated in 200-s epochs and plotted for each day as a percentage of the mean power of the control (red dashed line), estimated as the average of the 3 days before injection). Both the Schaffer (C) and the lac.-mol. (D) LFP generators exhibited a strong power increment that peaked 48 h after the treatment and decayed over the following days (Student’s t-test). Sample traces of reconstructed virtual LFPs at Day 0 (control) and two days post-injection are shown in (B).

