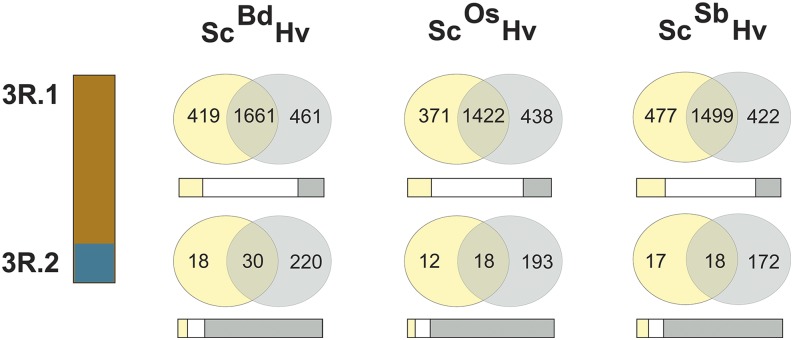
Figure 4.
Conserved Synteny Statistics of Rye Chromosome 3R and the Corresponding Barley Regions to Reference Genomes.
Venn diagrams show the absolute number of conserved syntenic rye (yellow) and barley (gray) genes in comparison to the reference grass genomes of B. distachyon, rice, and sorghum. The bars below depict the percentage of distribution of reference genes shared by barley and rye (white), or rye (yellow) and barley alone (gray), respectively. While the 3R.1 fragment shows a balanced conserved syntenic pattern, the second fragment 3R.2 showed 10-fold less conserved syntenic genes in comparison to the corresponding barley segment.

