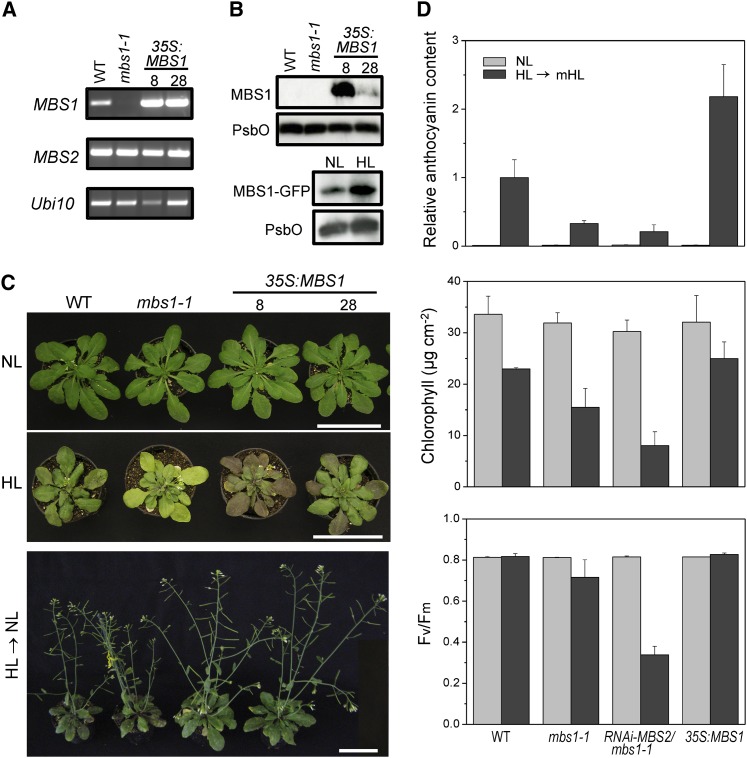
Figure 6.
MBS1 Expression Levels Determine the HL Tolerance of Plants.
(A) MBS transcript levels in the wild type (WT), the mbs1-1 mutant, and two MBS1 overexpression lines (8 and 28). RT-PCR analysis demonstrates overexpression of MBS1 in the 35S:MBS1 transgenic lines. MBS2 and Ubi10 served as internal controls.
(B) MBS1 protein levels in the wild type, the mbs1-1 mutant, and the MBS1-overexpressing lines. While in the wild type, the 11.3-kD MBS1 protein is not expressed to levels detectable with the sensitivity of our anti-MBS1 antibody, the protein is readily detected in the 35S:MBS1 overexpression lines (top panel). The protein is also detectable in one of the complemented lines expressing MBS1-GFP from the endogenous MBS1 promoter (bottom panel). To measure expression in response to HL stress, 4-week-old PMBS1:MBS1-GFP plants grown in soil were treated with HL (1000 μE m−2 s−1) for 3 h and then transferred to normal light (NL; 120 μE m−2 s−1) for 45 min. Untreated plants were maintained in normal light (120 μE m−2 s−1). Fifteen micrograms of total protein per sample was loaded. The PSII protein PsbO was used as loading control.
(C) Comparison of the phenotypes of wild-type plants, the mbs1-1 mutant, and two 35S:MBS1 overexpression lines under normal light conditions (µE m−2 s−1; 5-week-old plants; top panel), under HL stress (4-week-old plants exposed to light stress at 1000 µE m−2 s−1 for 5 d in a 16-h-HL/8-h-dark cycle; middle panel), and after recovery from HL and continued growth for 21 d under normal light (HL → NL; bottom panel). Bars = 6 cm.
(D) Light stress acclimation in Arabidopsis MBS mutants and overexpression plants. Anthocyanin contents, chlorophyll contents, and PSII activities were compared under light stress conditions (HL → mHL; 1000 µE m−2 s−1 for 3 d and then transfer to 600 µE m−2 s−1 for 3 d; 16-h-light/8-h-dark regime) and normal light (120 µE m−2 s−1). The wild type, the mbs1-1 and RNAi-MBS2 mbs1-1 mutants, and a transgenic 35S:MBS1 overexpression line were analyzed. Anthocyanin contents are displayed as relative values to the wild type after the stress treatment, which was assigned a value of 1. Data represent mean values ± sd of three biological replicates.

