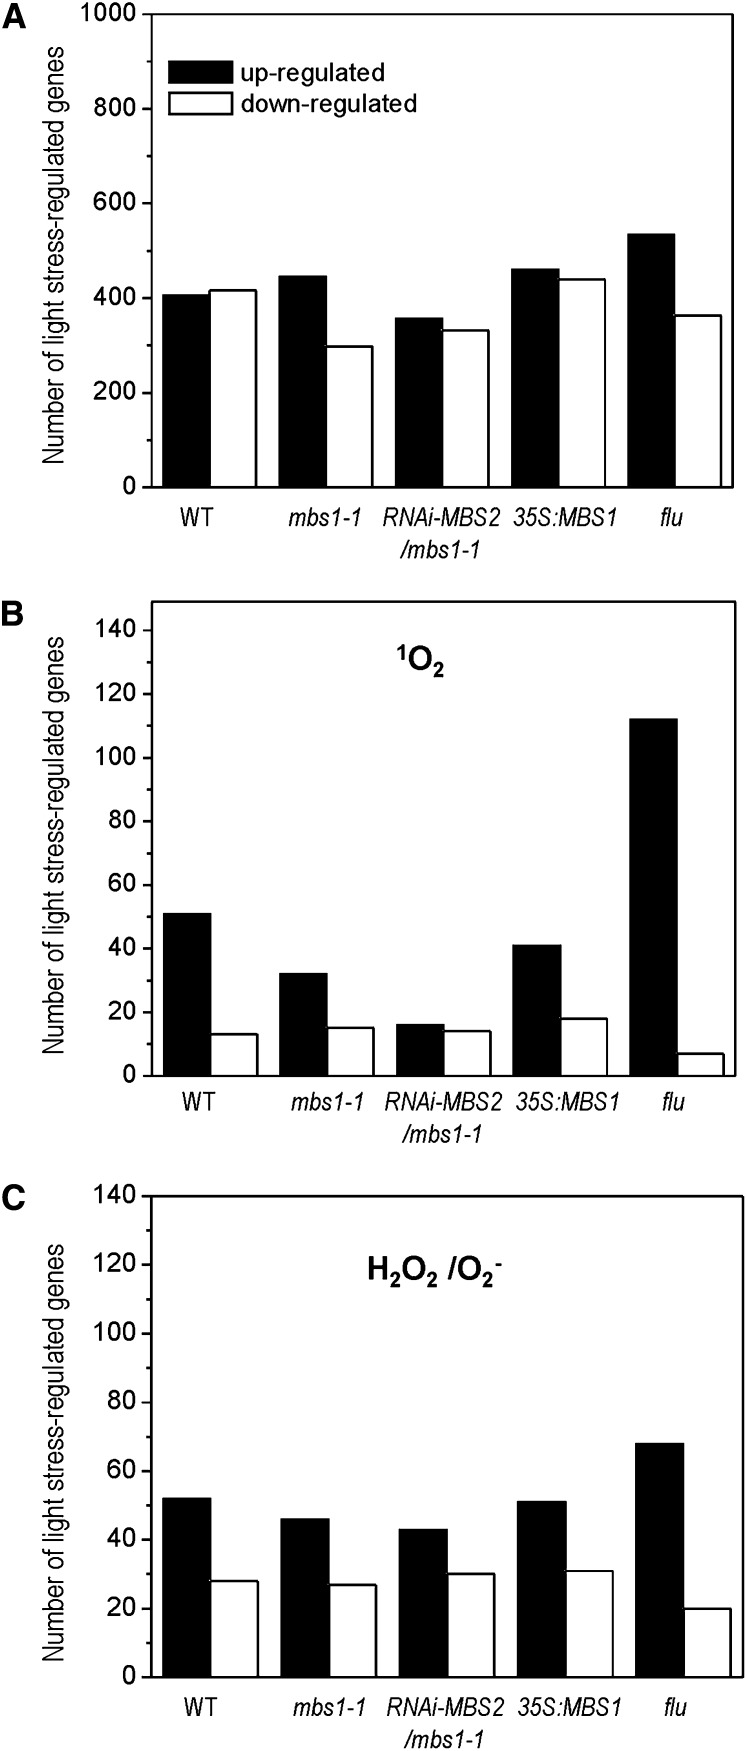
Figure 7.
Light Stress–Responsive Gene Expression in the Wild Type, the mbs1-1 Mutant, the RNAi-MBS2 mbs1-1 Double Mutant, the 35S:MBS1 Overexpression Line and the flu Mutant.
The genome-wide response of the transcriptome to a sudden shift from low-light to HL conditions was determined by microarray analysis.
(A) Light stress response of all genes represented on the ATH1 arrays. Total numbers of genes in the five plant lines that displayed a significant and greater than fourfold change 3 h after the onset of light stress. WT, wild type.
(B) Light stress response of the subset of genes previously reported as responsive to 1O2 (op den Camp et al., 2003; Gadjev et al., 2006). Panel shows number of genes in the subset showing significant and greater than fourfold response in the microarray analysis (see Supplemental Data Set 2 online).
(C) Light stress response of the subset of genes previously reported as responsive to H2O2/O2− (Gadjev et al., 2006). Panel shows number of genes in the subset showing significant and greater than fourfold response in the microarray analysis (see Supplemental Data Set 2 online).

