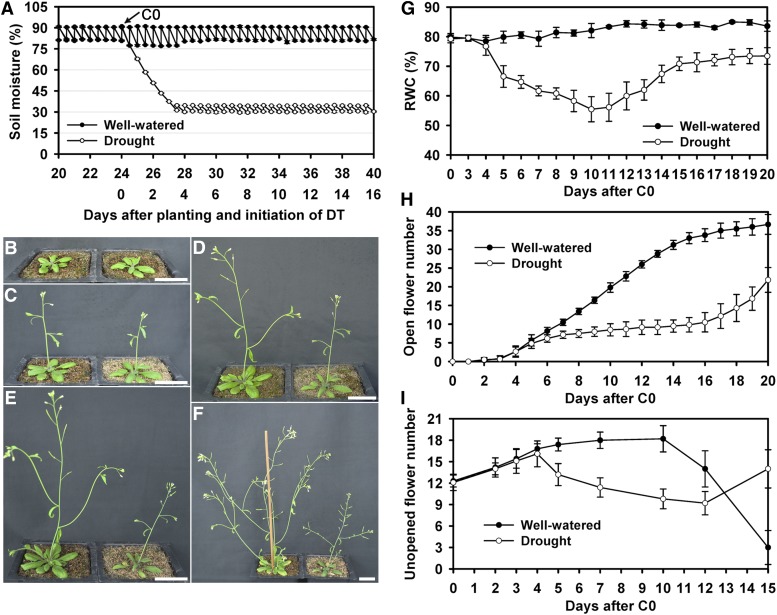
Figure 1.
Soil Water Moisture and Plant Growth during the Treatment Period.
(A) Soil moisture at d 20 to 40 from when the seeds were planted; the arrow points to control day 0 (C0) immediately before drought treatment. The data points and error bars represent the mean and se (n = 5).
(B) to (F) WW plants (left) and DT plants (right) at C0 (B), C3/T3 (C), C5/T5 (D), C7/T7 (E), and C10/T10 (F).
(G) RWC over the course of the treatment. The values for DT plants on days 5 to 20 are significantly different from those of the wild type (P < 0.01 by a Student’s t test.). The data points and error bars represent the mean and se (n = 9). Bar = 3 cm.
(H) The cumulative numbers of opened flowers on the main stem of WW plants and DT plants during the 20-d drought treatment. The DT plants differ significantly from the WW plants on days 6 to 20 (P < 0.01 by a Student’s t test.). The data points and error bars represent the mean and se (n = 6).
(I) The number of floral buds (from stages 8 to 12) on the main inflorescence stem, with significant difference between the DT and WW plants on days 5 to 12 (P < 0.01 by a Student’s t test.). The data points and error bars represent the mean and se (n = 6).
[See online article for color version of this figure.]

