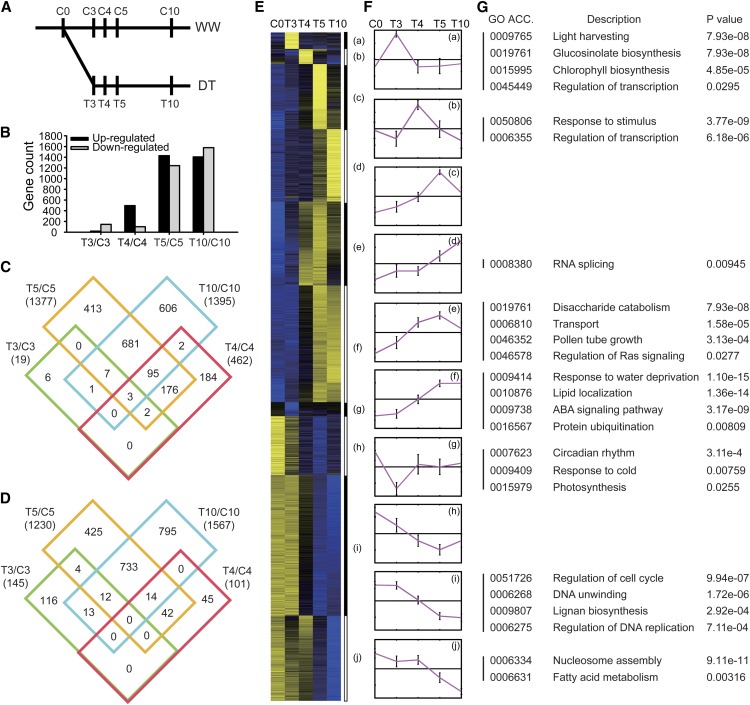
Figure 4.
Analysis of Transcriptomes from Inflorescences of WW and DT Plants.
(A) Samples were collected at C0, C3, C4, C5, and C10 for WW plants and T3, T4, T5, and T10 for DT plants.
(B) The numbers of the differentially expressed genes for T3/C3, T4/C4, T5/C5, and T10/C10.
(C) Venn diagram analysis of all upregulated genes of each group.
(D) Venn diagram analysis of all downregulated genes of each group.
(E) K-means clustering of differentially expressed genes. Expression distribution of genes activated or repressed 3 d after drought treatment. The number indicates log2 ratio of the fold change between the DT groups with the control group before start of the drought treatment (C0). Yellow color represents genes that have higher expression levels after drought stress and blue indicates reduced expression.
(F) The pink lines represent the mean expression profiles for each cluster. The y-axis is in log2 scale and the x-axis shows log2 (T0/C0), log2 (T3/C0), log2 (T4/C0), log2 (T5/C0), and log2 (T10/C0) in sequence.
(G) The GO enrichment analysis of genes in each cluster, with P values.

