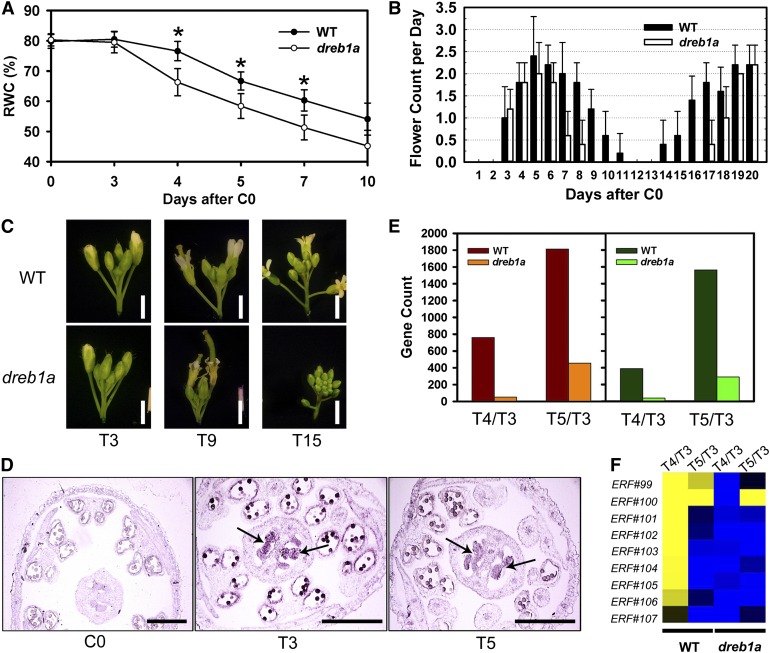
Figure 7.
Phenotypes and Gene Expression of the dreb1a Mutant.
(A) Leaf RWC of dreb1a compared with the wild type. Asterisks indicate values that are significantly different with P < 0.01 by a Student’s t test. The data points and error bars represent the mean and se (n = 6). WT, Wild type.
(B) Number of newly opened flowers each day during the DT from C0 to T20. The data points and error bars represent the mean and se (n = 8). WT, Wild type.
(C) Phenotype of the dreb1a inflorescence compared with that of the wild type under drought. WT, Wild type.
(D) DREB1A was not expressed in the wild type under WW condition at day 0 but was expressed at a high level in the wild-type ovule under DT at days 3 and 5 (arrows).
(E) Numbers of differentially expressed genes at T4/T3 and T5/T3 in dreb1a and the wild type. Warm colors indicate upregulated genes and cool colors indicate downregulated genes. WT, Wild type.
(F) A heat map of IXa and IXb subfamilies of ERF genes. WT, Wild type.
Bar in (C) = 2 mm; bar in (D) = 200 µm.

