Figure 8.
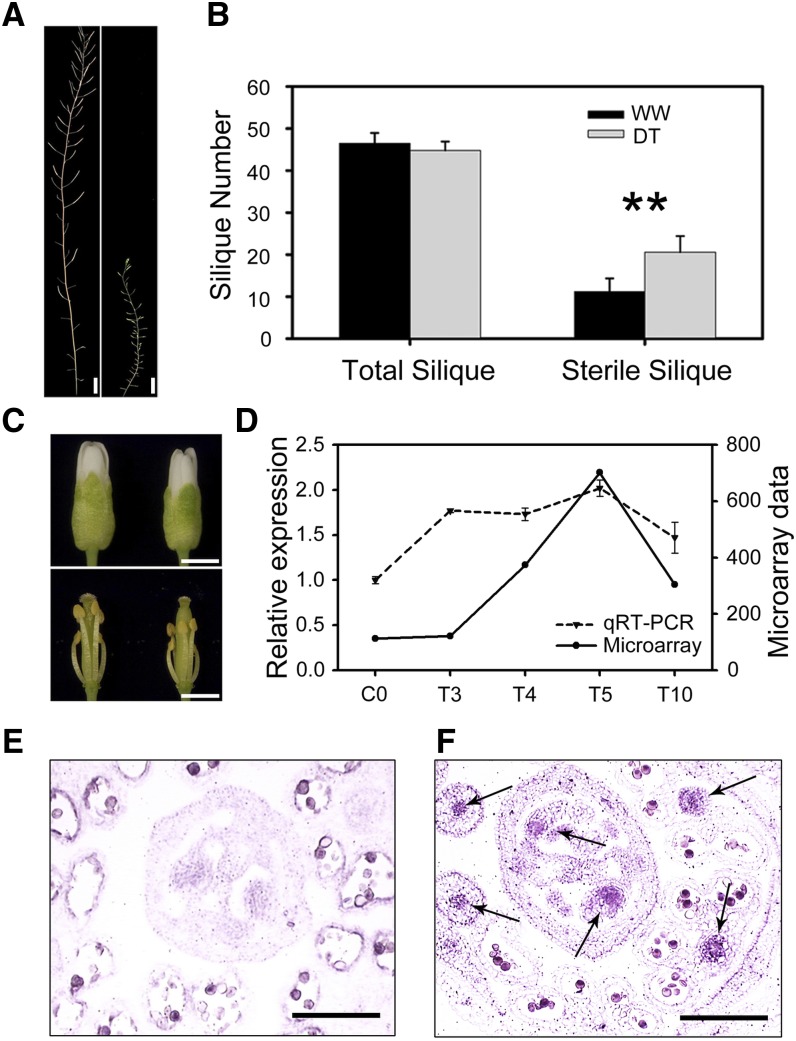
Molecular and Morphological Analyses of myb21 Mutants in Response to Severe Drought Stress.
(A) myb21 main stem under the WW condition (left) and under DT (right).
(B) Total fruit number and the sterile silique number on the main stem under the WW condition and DT. Asterisks indicate values that are significantly different with P < 0.01 by a Student’s t test. The data points and error bars represent the mean and se (n = 6).
(C) Wild type (top left) and myb21 (top right) stage 13 floral buds after 20-d drought treatment and the phenotypes after removing sepals and petals (bottom panel).
(D) Quantitative RT-PCR and microarray results of MYB21 in the wild type under drought at days 0, 3, 4, 5, and 10. Mean and sd of two biological replicates are presented in each case.
(E) In situ hybridization results showed MYB21 expression was at a very low level in the wild type under WW conditions at day 5.
(F) MYB21 expression was at a high level in wild type ovule and filament under drought treatment at day 5 (arrows).
Bar in (A) = 1 cm; bar in (C) = 2 mm; bar in (F) = 200 µm.

