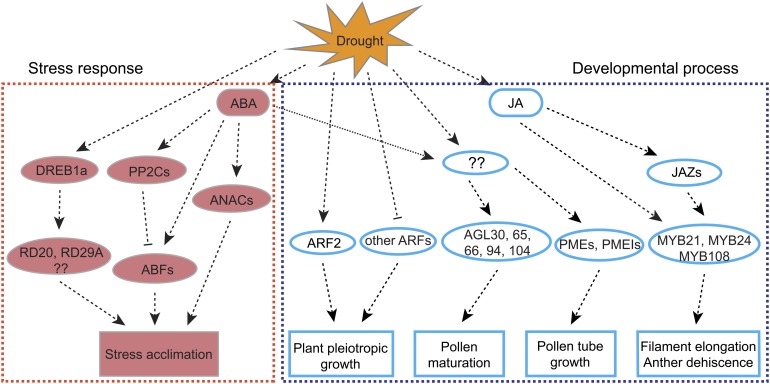
Figure 9.
A Proposed Regulatory Network of Drought Response in Arabidopsis Flowers.
Ovals represent genes with known functions in either stress response or developmental process; boxes show different proposed functions. Interactions are represented by dashed lines with arrows representing positive regulatory relationships based on past studies. Interactions with hammer-ended dashed lines represent inhibition. Red symbols indicate stress related, whereas cyan symbols indicate developmental regulation.
[See online article for color version of this figure.]

